
| Symbol | Company | Industry | P/E | Market Cap | Current Price | ROCE % | ROE % | Div Yield % | Fair Value |
|---|---|---|---|---|---|---|---|---|---|
| Pick a sector from the left to load stocks. | |||||||||
A stock screener filters thousands of listed companies down to a short, focused list using rules you choose. This guide explains what a stock screener is, why a sector-first approach makes company comparison fairer and easier, and how to use the EquityTimer screener across the Indian (NSE/BSE), US and South Korean (KRX) markets. It is written for education and research — factual data only, with no buy, sell or hold advice.
What a stock screener is
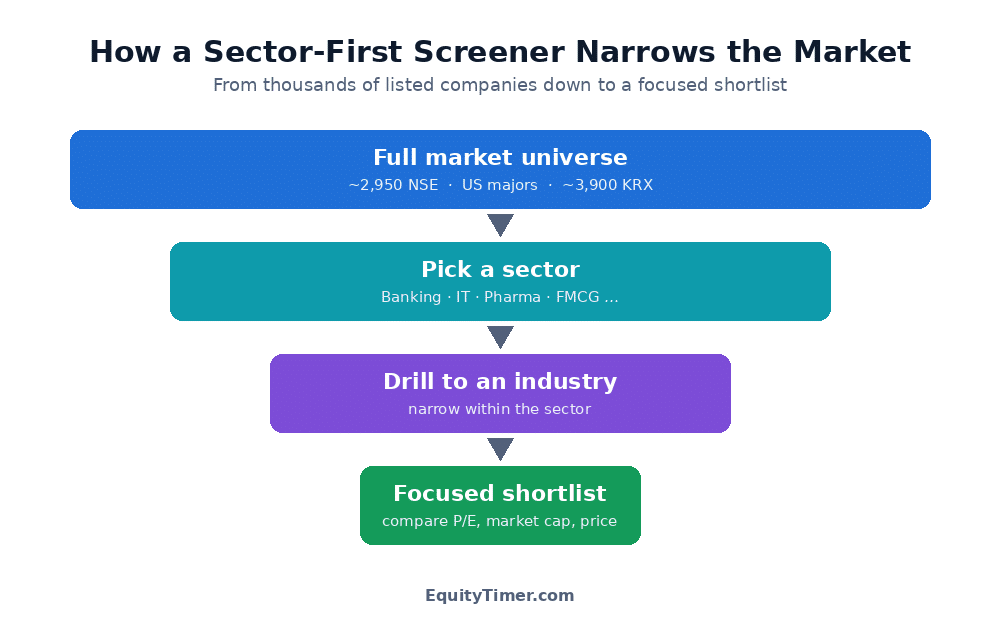
A stock screener is a tool that filters a large universe of listed companies down to a short, focused list using rules you choose — a sector, an index, a valuation range, or a financial-quality threshold. Instead of reading through thousands of companies one by one, you describe what you are looking for and the screener returns only the names that fit. It turns an unmanageable search into a workable shortlist in seconds.
The EquityTimer screener is built a little differently from most. Rather than dropping you in front of an empty filter box, it lets you browse by sector first, then narrow by industry, then by individual company. You can also filter by index — Nifty 50, Nifty 100 and others for India, or the major benchmarks for the US and Korea. It covers the Indian (NSE/BSE), US and South Korean (KRX) markets in one place, it is completely free, and it needs no login.
What it actually does
Every screener works on the same idea: a database of companies, a set of filters, and a results table. The differences are in which data is available, how the filters are organised, and how results are presented. Screening criteria fall into three families:
- Descriptive filters define the universe — sector, industry, market capitalisation, exchange and country. They answer “which group of companies am I even looking at?”
- Fundamental filters describe the business itself — price-to-earnings (P/E), return on capital, debt levels, dividend yield and growth. These are the heart of long-term, fundamentals-led research.
- Technical filters describe recent price behaviour — moving averages, momentum and volume. These matter more to short-term traders than to long-term investors.
EquityTimer is an education-first, fundamentals-led screener. The focus is on helping you understand companies sector by sector using factual financial data — not on generating buy or sell signals.
Why a sector-first stock screener helps
Most screeners assume you already know which filters to set. That is a fair assumption for an experienced analyst, but a real barrier for someone newer to the market. Browsing by sector removes that barrier: you can open Banking, IT, Pharma or FMCG, see every listed company inside it, and compare them side by side — P/E, market capitalisation and current price — without having to know a single filter in advance.
A sector-first view also makes comparisons fairer. A P/E of 35 means very little on its own, but next to the median P/E of its own sector it becomes informative. EquityTimer shows a sector P/E reference alongside the list, so each company is read in the context of its peers rather than in isolation.
The same logic across three markets
Whether you are looking at an Indian bank, a US technology company or a Korean manufacturer, the sector-first method works identically: start with the group, then narrow. Because the screener keeps each market separate, you always compare like with like — Indian pharma against Indian pharma, Korean chipmakers against Korean chipmakers.
Who it is for
This free stock screener suits several kinds of user:
- Long-term investors comparing companies within a sector on valuation and quality.
- Beginners who want a no-jargon way to explore the market by theme, without learning a long list of filters first.
- Anyone who wants a quick, free, sortable list of NSE, BSE, US or KRX stocks they can export to Excel for their own further study.
It is designed as a starting point for research — the first step in a process, not the last word on any company.
How to use the stock screener
The stock screener is usable in minutes, with no account and no setup.
1 · Choose your market
At the top, pick India, USA or Korea. India covers NSE- and BSE-listed companies; the US view covers the major American exchanges; Korea covers KOSPI and KOSDAQ names on the KRX. Switching markets reloads the screener with that country’s sectors, indices and companies, so you always work within one market at a time.
2 · Browse by sector and industry
On the left, click any sector to expand it into broad industries, then drill down to specific industries. Selecting a level instantly loads every company in that group into the results table. You can also type into the sector search box to jump straight to a sector by name. This is the fastest way to explore a theme — for example, opening Pharmaceuticals to see every listed pharma company together.
3 · Filter by index
Use the index chips near the top to narrow the table to a benchmark’s constituents — for instance, only the Nifty 50 names within the sector you are viewing. Useful when you want to focus on large, widely tracked companies rather than the whole universe. Select “All stocks” to clear the filter.
4 · Read the results table
The table shows each company’s symbol, name, industry, P/E ratio, market capitalisation and current price. Click any column heading to sort — lowest to highest P/E, or largest to smallest market cap — and click again to reverse. A sector P/E reference above the table lets you judge each company’s valuation against its own sector. Click any row to open that company’s full page: price history, financials, balance sheet, cash flow and shareholding.
5 · Search for any stock
If you already know the company, use the universal search bar to look it up by symbol or name across the whole market — no need to know its sector first. Matching results appear instantly.
6 · Export to Excel
Download a single sector’s list, or the entire market organised sector by sector, as an Excel/CSV file — for India, the US and Korea alike. Keep your own records, build a watchlist, or run further calculations in a spreadsheet. The export is free and needs no account.
7 · Turn the list into research, not a buy list
A screened list is a starting point, never a recommendation. A company appearing in your results only means it matched the criteria you chose — it does not mean it is a good investment. The real work begins after screening: reading each shortlisted company’s financials, understanding its business and its risks, and forming your own view. Treat the screener as a way to decide what to study next, and consult a SEBI-registered investment adviser before making any investment decision.
Screener vs scanner — what’s the difference?
The two terms overlap and are often used interchangeably, but in common usage they lean in different directions:
- A stock screener usually describes a tool for slower, research-led filtering — typically on fundamental data such as valuation, sector and financial quality.
- A stock scanner more often refers to fast, technical, intraday filtering used by active traders — moving averages, breakouts and volume spikes in real time.
EquityTimer is a fundamentals-led screener built for research and learning rather than intraday trading. It emphasises depth of financial data and easy sector comparison over real-time price signals, which suits the long-term, study-first way most investors use it.
Data & markets
The EquityTimer stock screener covers three markets in one place, each kept separate so comparisons stay like-for-like:
- India — NSE- and BSE-listed companies, with Nifty index filters.
- United States — companies on the major US exchanges, with benchmark filters.
- South Korea — KOSPI and KOSDAQ companies on the KRX.
How the data is sourced and refreshed
Fundamental figures — P/E, market capitalisation and financial statements — are drawn from companies’ own reported filings and refreshed periodically as new results are published. Prices shown on stock pages are end-of-day rather than live tick data, which is well suited to the long-term, research-oriented use the screener is designed for. Every figure is presented in the appropriate local currency.
EquityTimer publishes factual, educational data only. It is not a SEBI-registered adviser, and nothing in the screener is a recommendation to buy, sell or hold any security.
Frequently asked questions
Is the EquityTimer stock screener free?
Yes. The screener is completely free to use, with no subscription and no login required. You can browse every sector, filter by index, sort the results and export lists to Excel without creating an account.
Does it cover Indian, US and Korean stocks?
Yes. You can switch between the Indian market (NSE and BSE), the US market, and the South Korean market (KOSPI and KOSDAQ on the KRX) from a single screener. Each market loads its own sectors, indices and companies, with data shown in the appropriate currency.
How often is the data updated?
Fundamental figures such as P/E, market capitalisation and financial statements are drawn from companies’ reported filings and refreshed periodically. Prices on the stock pages are end-of-day rather than live tick data, which suits the long-term, research-oriented use the screener is designed for.
Can I download the screened list to Excel?
Yes. You can export a single sector’s companies, or the whole market arranged sector by sector, as an Excel/CSV file in one click — for India, the US and Korea. This is useful for building a personal watchlist or carrying out your own calculations in a spreadsheet.
Which is the best free stock screener for beginners?
The “best” screener depends on what you need. Active traders value real-time technical scanning; long-term investors value depth of fundamental data and easy comparison. For someone newer to the market who wants to explore companies sector by sector without learning a long list of filters first, a sector-first, education-led screener like EquityTimer is an approachable starting point — free, multi-market, and built around understanding rather than signals.
How do I use the sector P/E shown next to the results?
The sector P/E is the median price-to-earnings ratio of the companies currently listed in your view. It gives context: a single company’s P/E is far more meaningful compared with the typical P/E of its own sector than read on its own. It is a factual reference point for comparison — not a signal that any stock is cheap or expensive.
Does appearing in the screener mean a stock is a good buy?
No. A screener simply lists the companies that match the criteria you selected. It does not assess whether any company is a suitable investment, and nothing in the tool is a recommendation to buy, sell or hold. EquityTimer is not a SEBI-registered adviser; the data is provided for educational and informational purposes only. Always do your own research and consult a registered financial adviser before investing.
Educational and informational content only. EquityTimer is not a SEBI-registered investment adviser and does not provide buy, sell or hold recommendations. Data may contain errors or delays; verify independently and consult a registered financial adviser before making any investment decision.