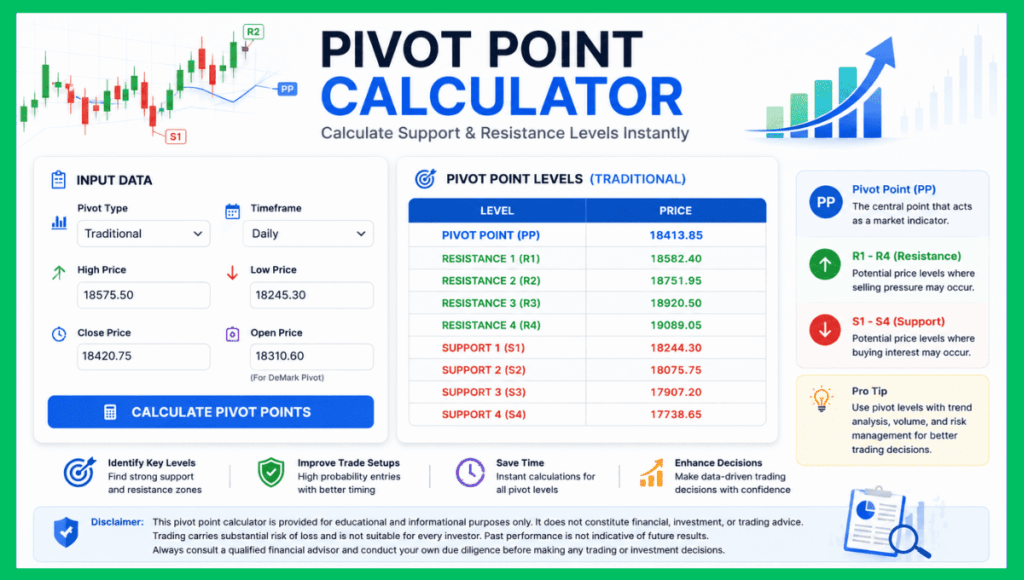
Pivot Point Calculator to Trade With Confidence
Pivot Point Calculator
Find Traditional, Fibonacci, Woodie, DeMark, Camarilla and Floor levels — up to R5 & S5 — for any market.
Pivot Levels
| Type | Level | Value |
|---|
💡 Smart Tips
- Always input the last completed candle’s data, not the live one.
- Day traders use Daily, swing traders use Weekly, position traders use Monthly.
- Treat PP as your bias line — above is bullish, below is bearish.
- Stronger reactions happen where multiple methods agree on the same zone.
⚠️ Trading Cautions
- Pivots highlight probability zones, not guaranteed turning points.
- Major economic releases and news events can cut through any level.
- Always set a hard stop-loss — never fight a strong trending move.
- Avoid relying on pivots alone in low-liquidity or pre-market hours.
📌 Disclaimer
This pivot point calculator is provided for educational and informational purposes only. It does not constitute financial, investment, or trading advice. Trading carries substantial risk of loss and is not suitable for every investor. Past performance is not indicative of future results. Always consult a qualified financial advisor and conduct your own due diligence before making any trading or investment decisions.
Pivot points are among the most widely used technical analysis tools in financial markets. Traders across stocks, forex, commodities, indices, and cryptocurrencies rely on pivot points to identify potential support and resistance levels for intraday, swing, and positional trading. Let me tell you, I have been personally using this pivot point trading system for more than two decades.
Picture this. You sit down at your desk before the market opens, coffee in hand, charts loaded. You want one simple answer: where is the price likely to react today? That single question has driven traders to pivot points for decades. A pivot point calculator provides an answer in seconds, turning yesterday’s price action into clean support and resistance.
This guide is built for two types of readers. The beginner who has heard about pivot points and wants to learn more. And the active trader who already uses them but wants to sharpen their understanding of how each method applies. We will cover what pivot points actually represent, the six pivot methods built into most calculators, the mathematical explanation behind each one, a fully worked trading example, and the real situations where pivot levels can change the way you trade. By the end, you should be able to open any pivot point calculator, plug in the right values, and read the output like a seasoned chart reader.
Pivot Points
A pivot point is simply an arithmetic average of the price of the previous period’s high, low, and close. That central number explains a clear picture of yesterday’s balance between buyers and sellers. Traders use these levels as forward-looking reference points for the next trading session.
The Anatomy of a Pivot Point Calculator
Most calculators share the same essential controls. The first is the calculator type, which lets you switch between Traditional, Fibonacci, Woodie, DeMark, Camarilla, and Floor methods. The second is the timeframe, usually Daily, Weekly, or Monthly. The third is the price input section, where you enter the previous period’s High, Low, Close, and (for DeMark only) Open.
The output is always the same shape. One central pivot, several resistance levels above it, and several support levels below it. Some methods produce three levels on each side, some produce four, and DeMark gives only one of each. This consistency is exactly what makes a pivot point calculator so easy to integrate into your trading journey.
Important terminology you need to know before learning about pivot points
Before going deeper, let us cut through the terminology that often trips up beginners. A handful of words appear repeatedly in pivot point material, and knowing what they actually mean makes the rest of this guide click into place.
Bias Line / Central Pivot Point
This is the central pivot point itself. Think of it as a horizontal separator on your chart. When the price trades above it, the day’s bias is bullish, and most traders look for buying setups. When the price is below, the bias flips bearish, and traders favor shorts. The bias line is your simplest filter for which direction to favor during the session.
Reaction Levels or Support Resistance levels
These are the support levels (S1, S2, S3) and resistance levels (R1, R2, R3) printed by the calculator. They are also called reaction levels because price tends to react when it reaches them, by slowing down, reversing, or breaking through with conviction. The numbered subscripts tell you how far each level sits from the central pivot. R1 is the nearest resistance above PP, while R3 (or R4 in Woodie and Camarilla) is the furthest.
Confluence
Confluence happens when two or more independent technical signals agree on the same price zone. For example, if your daily R2 sits at the same price as a previous swing high and a 50-period moving average, that is triple confluence. Confluence zones tend to produce stronger reactions because more traders are watching the same level for several reasons at once.
Bullish and Bearish Bias
Bullish bias means you expect the price to rise; bearish bias means you expect the price to fall. When pivot guides talk about a bullish bias above PP, they mean the math is leaning toward upward continuation.
Breakout vs. Reversal
A breakout occurs when the price punches through a pivot level and keeps going in that direction. A reversal happens when the price reaches a pivot level and turns back. Different setups suit different market environments, and knowing which one you are trading helps avoid confusion in the heat of the session.
Six Methods, Six Mindsets: Choosing Your Pivot Style
Different markets and trading styles favor different pivot models. Here is how each of the six methods thinks about the market.
Traditional (Classic) Pivots
The original. Equal weight is given to the high, low, and close, and three levels of support and resistance are projected on either side. If you only ever learn one method, this is it. Traditional pivots remain the benchmark because they appear identically across virtually every charting platform.
Fibonacci Pivots
Same starting pivot, different math for the levels. Fibonacci pivots layer the famous 38.2 percent, 61.8 percent, and 100 percent ratios on top of the previous period’s range. They appeal to chart readers who already use Fibonacci retracements and extensions, because the levels often confirm one another. When a Fibonacci pivot lines up with a Fibonacci retracement from a recent swing, the zone deserves extra attention.
Woodie Pivots
Woodie weights the closing price more heavily, on the theory that the close represents the market’s final consensus for the day. The result tends to skew levels toward recent strength or weakness. Many futures traders, especially those trading index contracts, prefer Woodie because it adapts faster to a strong directional close.
DeMark Pivots
The contrarian option. Tom DeMark’s method changes its formula depending on whether the previous candle closed above, below, or at its open. This makes DeMark especially useful for short-term traders who want a calculation that reflects directional momentum rather than static averages. It is the only method on this list that genuinely needs the Open price.
Camarilla Pivots
Camarilla compresses the levels closer to price, generating four supports and four resistances clustered around the previous close. It is built for intraday trading. Scalpers and short-term traders use the inner levels (S1, S2, R1, R2) for quick mean-reversion plays and the outer ones (S4, R4) as breakout triggers.
Floor Pivots
Same numbers as Traditional. Different name. Floor pivots come from the open-outcry trading-floor era, when local traders scribbled levels on note cards before the bell. If you ever see Floor listed separately on a calculator, recognize that the math is identical to Traditional. The label survives because many veteran traders learned the method under that name.
Inside the Math: Pivot Point Formulas Made Simple
Let H, L, C, and O stand for the previous period’s High, Low, Close, and Open.
Traditional and Floor
- PP = (H + L + C) divided by 3
- R1 = (2 times PP) minus L; S1 = (2 times PP) minus H
- R2 = PP plus (H minus L); S2 = PP minus (H minus L)
- R3 = H plus 2 times (PP minus L); S3 = L minus 2 times (H minus PP)
Fibonacci
- PP = (H + L + C) divided by 3
- R1 = PP plus 0.382 times (H minus L); S1 = PP minus 0.382 times (H minus L)
- R2 = PP plus 0.618 times (H minus L); S2 = PP minus 0.618 times (H minus L)
- R3 = PP plus 1.000 times (H minus L); S3 = PP minus 1.000 times (H minus L)
Woodie
- PP = (H + L + 2C) divided by 4
- R1 = (2 times PP) minus L; S1 = (2 times PP) minus H
- R2 = PP plus (H minus L); S2 = PP minus (H minus L)
DeMark
- If C is less than O, then X = H + 2L + C
- If C is greater than O, then X = 2H + L + C
- If C equals O, then X = H + L + 2C
- PP = X divided by 4; R1 = X/2 minus L; S1 = X/2 minus H
Camarilla
- R1 to R4 = C plus (H minus L) times 1.1, divided by 12, 6, 4, and 2, respectively
- S1 to S4 = C minus (H minus L) times 1.1, divided by 12, 6, 4, and 2, respectively
You don’t have to calculate any of these by hand once you have a calculator open, but understanding the structure helps you when something looks off and decide which method best matches your style.
From Zero to Setup: Using the Calculator in Six Steps
Step 1. Identify the previous closed period. For a stock day-trader, that is yesterday’s regular session. For a swing trader, last week’s candle. For a forex trader, the most recent New York 5 p.m. close.
Step 2. Pull the price data. Get the previous period’s High, Low, Close, and (for DeMark) Open from your charting platform. Double-check the session hours, since pre-market or after-hours data will produce wrong levels for stocks.
Step 3. Choose the method that matches your style. Day-trading equities? Try Camarilla. Swing-trading forex? Traditional or Fibonacci. Trading index futures? Woodie or DeMark. There is no single right answer; only the one that best fits your instrument and timeframe.
Step 4. Pick the right timeframe. Daily for intraday trades, Weekly for swing trades, Monthly for position trades. Mismatch this, and your levels lose meaning fast.
Step 5. Enter the prices and calculate. The calculator produces the central pivot, resistances above, and supports below in a fraction of a second.
Step 6. Plot the levels on your chart. This is the step beginners skip, and pros never miss. Visualizing the levels alongside live price is the difference between knowing pivot points exist and actually using them.
A Worked Example: Calculating Pivots and Trading Them
Theory is fine, but a real example makes the process concrete. Imagine you are day-trading a major index futures contract. Yesterday’s session ended with these prices.
- High: 19,825.50
- Low: 19,612.20
- Close: 19,754.10
Steps 1 and 2: Calculate the Levels
Plug these numbers into a pivot point calculator using the Traditional method. The math gives you a central pivot of (19,825.50 + 19,612.20 + 19,754.10) divided by 3, which is 19,730.60. From there, the calculator produces the full ladder of resistance and support levels shown below.
| Type | Level | Calculated Value |
| Resistance | R3 | 19,968.27 |
| Resistance | R2 | 19,944.07 |
| Resistance | R1 | 19,851.83 |
| Pivot | PP | 19,730.60 |
| Support | S1 | 19,635.97 |
| Support | S2 | 19,517.13 |
| Support | S3 | 19,422.50 |
Step 3: Plot the Levels Before the Open
Take all seven values and draw them as horizontal lines on your chart. Many platforms (TradingView, MetaTrader, ThinkOrSwim) let you do this with one click using a built-in pivot indicator. Now you have the day’s roadmap before a single trade is taken.
Step 4: Read the Open
At the cash open, price gaps higher and trades around 19,830, which sits between PP and R1. Because price is well above PP, the daily bias is bullish. Rather than chasing the gap, you wait patiently for a pullback.
Step 5: Spot the Entry Signal
Mid-morning, price retraces, briefly tags PP at 19,733, and prints a clean bullish engulfing candle on the 15-minute chart. Volume picks up on the rejection candle. This is your confirmation. The pivot is doing exactly what it is supposed to do: providing support.
Step 6: Place the Trade With Defined Risk
You enter long at 19,740. Your stop goes a few ticks below S1 at 19,625, giving roughly 115 points of risk. Your first target is R1 at 19,852, where you plan to scale out half the position and move the stop to break-even. The remaining position runs toward R2.
Step 7: Manage the Trade to Completion
Price climbs to R1, you take partial profit. The runner trades up to 19,925, stalls just below R2, and then begins to roll over. You exit the runner at 19,915, locking in a strong risk-to-reward result. From entry to exit, every decision was anchored to a pivot level: PP for entry confirmation, S1 for the stop, R1 for the first target, R2 for the runner.
Real Trading Scenarios Using Pivot Points
Catching Reversals Trades at Key Levels
In a quiet, range-bound session, the price tends to oscillate between pivot levels. The setup looks like this. Wait for the price to touch S1, with a candle showing rejection, such as a hammer, a doji, or a bullish engulfing pattern. Enter long, place a stop slightly below S2, and target a return to PP. Mirror the play near R1 for short trades. Range-bound days are the natural habitat of pivot reversal traders.
Breakouts Trading Beyond R2 and S2
When momentum builds, price punches through resistance and barely looks back. A break of R2 with rising volume often signals continuation toward R3 or beyond. The smarter entry is on the retest of R2 (now acting as support) rather than on the initial breakout candle, where slippage and false breakouts are common. The same logic applies in reverse below S2 and S3.
Filtering Trades With the Daily Pivot
A simple rule that improves many trading systems: take long signals only when the price is above PP, and short signals only when below. This single filter can dramatically reduce the number of low-quality trades you take, because it forces you to align with the dominant intraday flow rather than fighting it.
Smarter Stops and Targets
Even traders who never enter a trade at a pivot level still find them useful for trade management. Placing a stop just beyond S1, rather than a round number, puts your stop at a structurally meaningful level that the market actually respects. The same applies to profit targets at R1 or R2. These objective exits reduce much of the second-guessing that harms discretionary trading.
Risk Management for Beginners: Setting Stop Loss and Targets
Risk management is what separates traders who survive their first year from those who do not. Pivot points provide a ready-made structure for both stop-loss and take-profit orders, which is one of the most underrated benefits of using them.
Where to Place Your Stop-Loss
For a long trade entered near a support level, place your stop slightly below the next support level down, not directly at it. Price often hits a level briefly before reversing, so giving the trade a little breathing room reduces the chance of being stopped out on noise. For example, if you buy near S1, your stop goes a few ticks below S2. For short trades, the mirror applies. If you sell near R1, your stop goes slightly above R2.
Avoid placing stops at obvious round numbers (such as 100, 19,500, or 1.2000). Round numbers attract clusters of stop-loss orders, and large players sometimes push prices toward them deliberately to trigger a flush before reversing. Pivot levels are less obvious targets, which keeps your stop safer.
Where to Place Your Take-Profit
Beginners benefit from a two-target approach. The first target is the nearest pivot level in the direction of the trade. If you entered long near S1, that is PP. If you entered long on a break of R1, that is R2. The second target is the next level beyond, ideally adjusted so your reward-to-risk ratio is at least 1.5 to 2. Lock in partial profit at the first target and trail the rest toward the second.
Beginner-Friendly Risk Rules
- Never risk more than 1 to 2 percent of your account on any single pivot trade.
- Use limit orders for entries when possible, so you do not overpay during fast moves.
- Move your stop to break-even after the trade reaches your first target. This turns the trade into a free option on further profit.
- If price stalls between two pivot levels for more than 30 minutes without direction, exit and wait for a cleaner setup.
- Define your stop-loss before you enter, write down the exact price, and never widen it once the trade is live. Pivot levels make this discipline easier because they are objective and non-negotiable.
Pivot Point Trading: The Honest Truth: Strengths and Weaknesses
What Pivots Do Well
- They are objective. Levels come from a formula, not from feelings, which removes much bias.
- They are leading rather than lagging. Pivot levels are calculated before the session begins and stay fixed.
- Pivot point trading works across all markets, including forex, equities, futures, commodities, and crypto.
- They benefit from crowd behavior. So many traders watch the same levels that the price often reacts to them simply because participants act on them.
Where Pivots Fall Short
- Strong trends can blow through every pivot level without pausing for breath.
- Sometimes it does not follow during big events, you may avoid trading these days
- Major economic releases distort short-term price action, and pivot setups around news are unreliable.
- Pivots cannot account for new fundamental information that emerges mid-session.
- Over-relying on pivots without confirmation tools leads to overtrading and a flat equity curve.
Side-by-Side: Comparing the Six Pivot Methods
| Method | Best Suited For | Standout Feature |
| Traditional | Beginners and all-purpose use | Most universally watched, easy to learn |
| Fibonacci | Trend traders using retracements | Layers Fibonacci ratios over the prior range |
| Woodie | Index futures and momentum traders | Weights the close more heavily for recency |
| DeMark | Short-term traders watching open vs close | Conditional formula reflects directional bias |
| Camarilla | Intraday scalpers and day traders | Tight, action-ready levels closer to price |
| Floor | Traders who learned the classic method | Same math as Traditional under a different name |
Practical advice: pick two methods, run them through your calculator using the same High, Low, and Close for an instrument you trade often, and overlay both sets of levels on the chart for at least a week. The method whose levels most closely match the price is your fit.
Picking the Right Timeframe for Your Style
Daily pivots are the bread and butter of intraday traders. They reset every session and reflect on yesterday’s action. Use them if you open and close trades within the same trading day.
Weekly pivots stay valid Monday through Friday and reflect last week’s range. They suit swing traders who hold positions for several days.
Monthly pivots cover an entire trading month and are favored by position traders and longer-term investors. When daily, weekly, and monthly levels stack within a tight zone, that confluence is gold. Treat it as a high-conviction support or resistance area.
A simple practice that works for many traders: plot all three timeframes on your chart. Trade in line with the higher-timeframe bias, and use the lower-timeframe levels for entries and exits.
Practical Tips That Make Pivot Points Sharper
- Lock in a single session-close convention and stick with it so your levels stay consistent day to day.
- Look for confluence. Pivot levels mean far more when they overlap with prior swing highs, prior swing lows, round numbers, or moving averages.
- Pay close attention to the first reaction. How price behaves at the first pivot it touches each session often sets the tone for the rest of the day.
- Skip pivot setups during major economic releases. Volatility around news distorts the levels and triggers stop-loss cascades.
- Backtest before going live. Apply your chosen method to at least 30 days of recent data on the instruments you trade and track win rate, average risk-to-reward ratio, and drawdown.
- Pair pivots with one momentum indicator, such as the RSI or MACD, for a clean entry trigger. Pivots define where; the indicator tells you when.
Common Mistakes Traders Make With Pivot Points (And How to Avoid Them)
Most beginner losses with pivot points come from a small set of repeatable errors. Here are the seven most common ones, and exactly how to keep yourself out of each trap.
Mistake 1: Using current intraday data instead of the previous closed period.
How to avoid: Always wait until the previous session has officially closed before pulling High, Low, and Close. For day trading, that means yesterday’s full session data, not the last hour of action. Set a calendar reminder for the cash close so you do not forget.
Mistake 2: Mixing session hours, such as feeding extended-hours stock data into a calculator that should use regular hours.
How to avoid: Decide once whether you will use regular session or extended hours data, and stick with that choice across every calculation. Inconsistency creates levels that do not behave like other traders’ levels.
Mistake 3: Treating every pivot level as a guaranteed reversal point and entering trades without confirmation.
How to avoid: Always wait for confirmation before entering. A candlestick rejection pattern, divergence on an oscillator, or a clear volume spike at the level are all valid signals. Pivot levels are zones of probability, not magic numbers.
Mistake 4: Ignoring the broader trend on higher timeframes and trying to fade strong directional moves at S1 or R1.
How to avoid: Check the daily and weekly chart bias before placing intraday trades. If the daily trend is strongly bullish, prioritize long setups at S1 over short setups at R1. Trade with the higher-timeframe wind, not against it.
Mistake 5: Forgetting to recalculate at the start of each new period, leaving outdated levels on the chart.
How to avoid: Build a fixed habit. Calculate fresh daily pivots before the open, weekly pivots over the weekend, and monthly pivots on the last weekend of the month. Most charting platforms can do this automatically with a built-in indicator.
Mistake 6: Stacking too many pivot methods at once until the chart becomes a tangle of horizontal lines.
How to avoid: Pick two methods at most. A common combination is Traditional plus Camarilla. Anything beyond that erodes decision quality and slows your reaction time during the session.
Mistake 7: Trading pivot setups during major economic news events.
How to avoid: Mark high-impact economic releases on your calendar (CPI, NFP, central bank decisions, earnings reports) and avoid new pivot trades 15 minutes before and 30 minutes after each release. Volatility around news rarely respects pivot levels.
Where to Find Pivot Point Calculators and Charting Tools
You do not need an expensive subscription to start using pivot points. Several free, beginner-friendly platforms offer both calculations and charting in one place.
Free Charting Platforms With Built-In Pivots
- TradingView is widely considered the best free charting platform for retail traders. The built-in Pivot Points (Standard) indicator covers Traditional, Fibonacci, Woodie, Camarilla, and DeMark methods, with daily, weekly, monthly, and yearly options. The free tier is more than enough for most beginners.
- MetaTrader 4 and 5 remain the standard platforms for forex traders. Both support pivot point indicators through free downloadable add-ons available on the MQL5 marketplace. Most regulated brokers offer MT4 or MT5 free of charge with a live or demo account.
- ThinkOrSwim by Charles Schwab offers a free, professional-grade platform with a built-in pivot points study, available to US brokerage account holders.
- TrendSpider and StockCharts have free tiers that include pivot point overlays for stocks and ETFs, useful for swing traders focused on US equities.
Mobile Apps for On-the-Go Traders
- TradingView Mobile, the iOS and Android apps from major brokers (such as IG, Interactive Brokers, and OANDA), and dedicated calculator apps in the Play Store and App Store all support pivot point lookups when you are away from your desk. Useful for swing traders monitoring overnight positions.
Recommended Beginner Setup
If you are just starting out, the simplest workflow looks like this. Open a free TradingView account. Add the built-in Pivot Points (Standard) indicator to your chart. Set the timeframe to Daily and the method to Traditional. Pair this with a free demo trading account from a regulated broker so you can practice placing trades around pivot levels without risking real money. Watch how the price interacts with the levels over the next two to four weeks before going live. This zero-cost combination is enough to build genuine pivot point fluency.
Frequently Asked Questions
1. Do pivot points work better in some markets than others?
Pivot points work across forex, stocks, indices, futures, commodities, and crypto. That said, they tend to perform best in liquid markets with consistent session hours, such as major forex pairs, large-cap stocks, and index futures. Thin or low-volume instruments produce erratic price action that can ignore pivot levels entirely.
2. How are pivot points different from Fibonacci retracements?
Both highlight potential support and resistance, but they answer different questions. Pivot points are calculated from the previous period’s High, Low, and Close and stay fixed for the upcoming session. Fibonacci retracements are drawn between two specific price points (a swing high and a swing low) and adjust whenever the swing changes. Many traders use both together because the confluence between the two adds confidence to a level.
3. What is the best pivot point method for day trading?
Most day traders gravitate toward Traditional or Camarilla pivots. Traditional pivots have the largest crowd behind them, which makes the levels reliable. Camarilla pivots produce tighter, action-ready levels that suit fast intraday markets. Test both on your preferred instrument and choose the one whose levels are more consistently priced.
4. Can I use pivot points on a 5-minute chart?
Yes. The pivot levels are still calculated from the daily High, Low, and Close, but you can apply them to any intraday chart, including 5-minute or 1-minute charts. Lower-timeframe charts simply give you more precision for entries and exits around the same daily levels.
5. Why do pivot points matter if they are based on past data?
All technical indicators are based on past data; the question is what they do with it. Pivot points project forward-looking levels for the upcoming session and stay fixed throughout. Their predictive value comes from crowd behavior and the simple fact that yesterday’s high, low, and close mark real psychological boundaries that traders revisit.
6. Should I always trade in the direction of the pivot?
Trading with the pivot bias is a sensible default for trend traders. Long bias above PP, short bias below PP. Counter-trend traders, however, deliberately fade extreme moves to S2 or R2, expecting the price to revert toward PP. Both styles are valid. The key is matching the strategy to the market environment, with trend-following in trending sessions and mean-reversion in ranges.
7. How do I know when a pivot level has failed?
A pivot level is considered broken when the price closes decisively beyond it, ideally with strong volume, and then trades back to retest it without reclaiming the level. A failed S1 turns into resistance on the way back up; a failed R1 often becomes support on the way down. The retest is where many of the best trades happen.
8. Are pivot points reliable in crypto markets?
They can be, but you need to define your session boundary clearly. Because crypto trades around the clock, traders typically use the UTC midnight close or the 8 p.m. ET close used by major exchanges. Once that is fixed, the math behaves the same as in any other market. Volatility in crypto means false breakouts are more common, so confirmation tools become extra important.
Final Thoughts
Pivot points are one of the few tools in technical analysis that combine simplicity, objectivity, and crowd consensus in a single package. A pivot point calculator does the heavy lifting on the math; your job is to interpret the levels in context, manage risk, and stay disciplined when the market does something unexpected. Master these levels, treat them as guides rather than guarantees, and they will sharpen your decision-making across every market and every timeframe.