
Discounted Cash Flow (DCF) Calculator
💡 Key Tips
- Use the average free cash flow of the last 2–3 years as your base to smooth out one-off years.
- Keep the discount rate around 10–12% for stable large caps; raise it for riskier businesses.
- Terminal growth should stay near long-run inflation (3–5%) and always below the discount rate.
- Only act when the fair value sits comfortably above the price — that gap is your margin of safety.
⚠️ Investing Cautions
- A DCF is only as reliable as its inputs — small changes in growth or discount rate move the result a lot.
- The terminal value often dominates the total; treat that portion with extra caution.
- This model works best for profitable, cash-generating companies — not banks or loss-makers.
- Fair value is an estimate, never a guarantee. Cross-check against other methods before deciding.
📋 Disclaimer
This calculator is provided for educational and informational purposes only and does not constitute financial or investment advice. DCF analysis relies on forward-looking assumptions that may not hold, and results are highly sensitive to inputs. Past performance is not indicative of future results. Always consult a SEBI-registered advisor and do your own research before investing.
📐 How the Fair Value Is Calculated
1. Cash Flow Per Share (base)
2. Two-Stage Growth (10 years)
3. Discount Each Year to Present Value
4. Terminal Value (Gordon Growth)
5. DCF Fair Value Per Share
A Discounted Cash Flow (DCF) model estimates what a business is truly worth by projecting the cash it will generate and converting that future cash into a single present-day figure — its intrinsic value. This guide explains the DCF model in plain English, walks through the formula, works a full real-data example on a US stock (NVIDIA), and shows how to use the EquityTimer DCF calculator. It is written for education and research only — factual data, with no buy, sell or hold advice.
What a DCF valuation model is
A Discounted Cash Flow model answers one question: what is a company worth today, based on the cash it is expected to produce in the years ahead? The market price on your screen moves with news and sentiment, but the underlying worth of a business rests on the cash it can generate for its owners over time. A DCF translates that stream of future cash into a single present-day number called the intrinsic value.
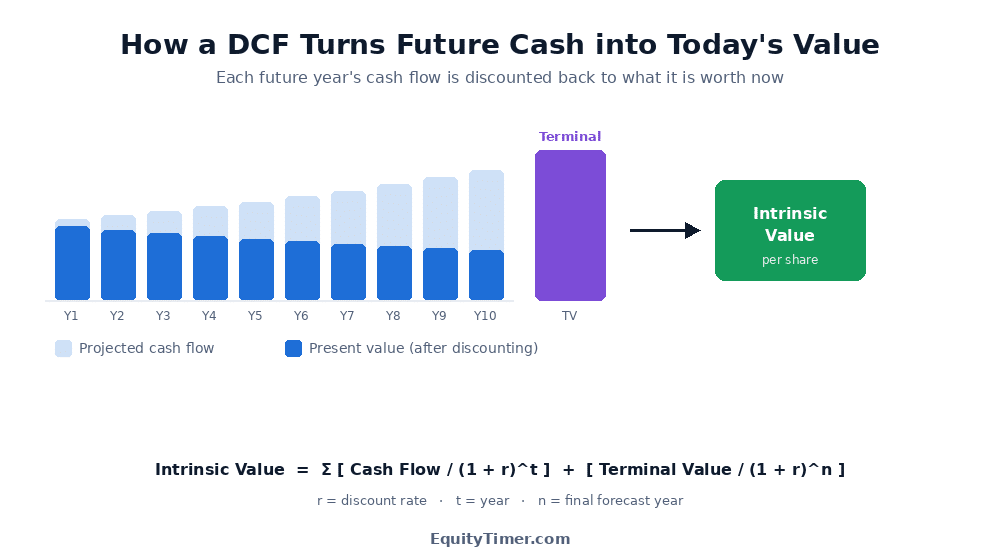
The idea rests on a simple truth from everyday life: a dollar in your hand today is worth more than a dollar promised five years from now, because today’s dollar can be invested and grow. A DCF applies exactly that logic to a business. It forecasts future cash flows, shrinks each one back to its worth today — a step called discounting — and adds them up. The result is an estimate you can compare against the current share price.
Why cash flow, not reported profit
A DCF works from free cash flow rather than the reported net profit line. Reported profit can be shaped by accounting choices — how depreciation is booked, when revenue is recognised, one-off gains and losses. Free cash flow is harder to dress up because it tracks the actual cash a company has left after paying to run and grow itself. That makes it a cleaner measure of genuine earning power, which is why serious valuation work is built on it.
The DCF formula, explained
At its heart, a DCF rests on one master equation. It looks heavy at first, but each part is straightforward once broken down.
Intrinsic Value = Σ [ CFt ÷ (1 + r)t ] + [ TV ÷ (1 + r)n ]
The first part sums the present value of each forecast year’s cash flow. The second part adds the discounted terminal value — the worth of everything beyond the forecast window. The terminal value itself is found with the Gordon Growth method:
Terminal Value = CFn × (1 + g) ÷ (r − g)
What each symbol means
| Symbol | Meaning |
|---|---|
| CFt | Free cash flow in a given year, grown from the base year |
| r | Discount rate (the return you require), as a decimal |
| t | Year number (1, 2, 3 … n) |
| n | The final year of the forecast period |
| g | Terminal (perpetual) growth rate, kept low and steady |
The two-stage approach
Companies rarely grow at one fixed rate forever. A common and more realistic method splits the forecast into two stages: a higher-growth phase for the first five years, then a slower “fade” phase for years six to ten as growth normalises. After year ten, the terminal value captures everything that follows at a modest perpetual rate. The EquityTimer calculator uses this two-stage, ten-year structure.
A worked example: NVIDIA (NVDA)
The clearest way to understand a DCF is to run one. Here we use real reported figures for NVIDIA, a US-listed company, and the same two-stage method the EquityTimer calculator applies. The inputs:
| Input | Value |
|---|---|
| Latest free cash flow | $96.68 billion |
| Shares outstanding | 24.5 billion |
| Free cash flow per share (base) | $3.95 |
| Discount rate (r) | 10% |
| Terminal growth (g) | 3% |
Starting from $3.95 per share, each year’s cash flow is grown, then discounted back to its present value. Here is how the ten years unfold, followed by the terminal value:
| Year | Cash flow / share | Discount factor | Present value |
|---|---|---|---|
| Year 1 | $4.30 | 1.100 | $3.91 |
| Year 2 | $4.69 | 1.210 | $3.87 |
| Year 3 | $5.11 | 1.331 | $3.84 |
| Year 4 | $5.57 | 1.464 | $3.80 |
| Year 5 | $6.07 | 1.611 | $3.77 |
| Year 6 | $6.62 | 1.772 | $3.74 |
| Year 7 | $7.21 | 1.949 | $3.70 |
| Year 8 | $7.86 | 2.144 | $3.67 |
| Year 9 | $8.57 | 2.358 | $3.63 |
| Year 10 | $9.34 | 2.594 | $3.60 |
| Terminal | — | 2.594 | $53.00 |
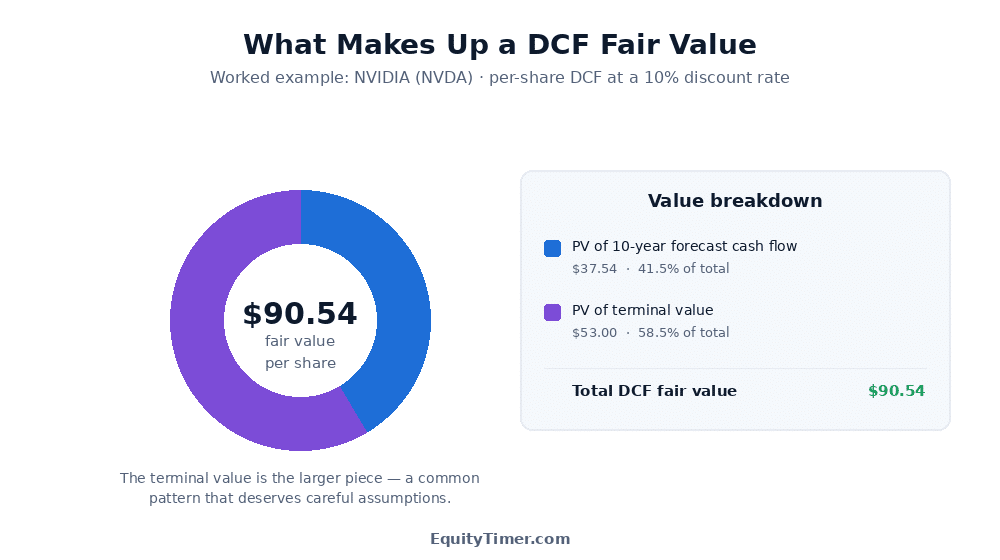
Adding the ten discounted cash flows gives about $37.54 per share. The discounted terminal value adds $53.00. Together, the DCF fair value is roughly $90.54 per share.
Reading the result honestly
At the time of writing, NVIDIA traded near $202 per share — well above this DCF estimate of about $90. That gap is a valuable lesson, not a flaw in the method. A conservative, cash-flow-only model captures what the business earns today grown at a measured pace; it does not capture the very high future growth the market is currently pricing in. When a fast-growing company trades far above its DCF value, it usually means the market expects growth well beyond what a cautious model assumes. This is precisely why analysts test their assumptions, and why a DCF is most reliable for steady, predictable businesses.
Choosing sensible inputs
A DCF is only as good as the assumptions behind it. Three inputs drive most of the result.
Discount rate
The discount rate reflects the return you require and the risk of the cash flows. For large, stable US companies, a rate in the region of 8–10% is commonly used; riskier or smaller companies justify a higher rate. A higher discount rate lowers the intrinsic value, and a lower rate raises it — so this single number matters a great deal.
Terminal growth rate
Because no company can outgrow the wider economy forever, the terminal growth rate should stay modest — typically at or below long-run economic growth, often around 2–4%. It must always be lower than the discount rate; if the two get close, the terminal value inflates to a meaningless size.
Free cash flow
Free cash flow is operating cash flow minus capital expenditure. Draw it from the cash flow statement rather than working back from reported profit, and consider using an average of the last two or three years to smooth out one-off periods.
A practical rule: keep assumptions conservative. If small changes to growth or the discount rate swing the valuation wildly, treat the result with extra caution and lean towards cautious inputs.
DCF vs the P/E ratio
The price-to-earnings (P/E) ratio is quick and popular, but it looks backwards — it tells you what the market paid for past earnings, not what the business is worth going forward. A DCF is forward-looking and absolute: it values a company on the cash it is expected to generate. The two are best used together.
| Aspect | DCF | P/E ratio |
|---|---|---|
| Direction | Forward-looking | Backward-looking |
| Based on | Future free cash flow | Past earnings |
| Output | An intrinsic value per share | A relative multiple |
| Speed | Slower, assumption-heavy | Fast, single number |
| Best for | Deep analysis of cash generators | Quick screening and comparison |
A sensible workflow is to screen quickly with P/E to build a shortlist, then run a DCF on the names that pass for a deeper, fundamentals-led view. Neither replaces the other; combined, they give both speed and depth.
The terminal-value caution
As the NVIDIA example showed, the terminal value often makes up the majority of a DCF result — frequently 55–80% of the total. Because it captures decades of cash compressed into one figure, a small change to the terminal growth rate can move the whole valuation. Always treat that portion of the model with extra care.
Using the EquityTimer DCF calculator
The calculator runs the same two-stage, per-share model shown above, so you can test any company’s numbers in seconds — no account needed.
1 · Enter the company and cash flow
Type the company name (and optional ticker), then the latest free cash flow and shares outstanding. The calculator divides one by the other to get a per-share cash flow base. If free cash flow is not available, you can enter EPS instead.
2 · Set the growth and discount assumptions
Enter the growth rate for the first five years. In the advanced panel you can adjust the fade rate for years six to ten, the discount rate, and the terminal growth rate. Sensible defaults are pre-filled, so you can start simple and refine later.
3 · Add the current price
Enter today’s market price. The calculator compares your DCF fair value against it and shows the gap as a percentage, alongside a visual gauge.
4 · Read the results
You will see the DCF fair value per share as the headline, a breakdown of the present value of forecast cash flow versus terminal value, the terminal-value weight, and a “buy below” figure based on your chosen margin of safety. A year-by-year table shows every cash flow, discount factor and present value.
5 · Works in your currency
The calculator adapts to the stock’s market — US dollars for American stocks, rupees and crore for Indian stocks, and other currencies detected from the ticker — so the figures always read naturally.
For a full, automatic valuation that combines several models on real filings, you can also open the EquityTimer Fair Value / Intrinsic Value calculator, which computes a DCF-based fair value for thousands of stocks without any manual entry.
Limitations & data
A DCF is a powerful framework, but it has real limits worth understanding before you rely on it.
- Assumption-sensitive. Small changes to growth or the discount rate can move the answer a lot — “garbage in, garbage out” applies fully.
- Terminal-value heavy. The majority of the value often sits in the terminal figure, which rests on a single perpetual growth assumption.
- Not for every company. A DCF works best for profitable businesses with reasonably predictable cash flows. It is far less reliable for banks, early-stage companies, or firms with erratic or negative cash flows.
- An estimate, not a fact. The output is a considered estimate within a range, never a precise price.
How the data is used
The worked figures in this guide are drawn from companies’ own reported filings. Where the calculator uses stored company data, fundamental figures such as free cash flow, earnings and share counts come from reported statements and are refreshed periodically. Current share prices are entered by the user, since the model compares your DCF value against the price you provide.
EquityTimer publishes factual, educational content only. It is not a SEBI-registered adviser, and nothing here is a recommendation to buy, sell or hold any security.
Frequently asked questions
What does a DCF valuation actually tell me?
It gives you an estimate of a company’s intrinsic value — what the business is worth today based on the cash it is expected to generate in future. You then compare that estimate with the market price to see how the two differ. It is an analytical estimate, not a recommendation.
What is the difference between DCF and NPV?
They share the same discounting logic. Net Present Value usually subtracts an upfront investment to show the net value a project creates, while a DCF valuation sums the present value of future cash flows to estimate what a whole business or share is worth. In practice, the total discounted cash flow of an investment is often described as its net present value.
Why does the terminal value make up so much of the total?
Because it captures every cash flow beyond the explicit forecast — potentially decades of them — compressed into one figure. It commonly represents 55–80% of a DCF total, which is why the terminal growth rate must be chosen carefully and kept modest.
What discount rate should I use for US stocks?
Use a rate that reflects the risk of the specific company. For large, stable US companies, a discount rate around 8–10% is commonly applied; riskier or smaller companies justify a higher rate. A higher discount rate lowers the intrinsic value and a lower one raises it.
Can I use a DCF for any company?
It works best for profitable businesses with reasonably predictable, positive free cash flow. It is far less reliable for banks, very early-stage companies, or firms with erratic or negative cash flows, where the required assumptions become guesswork.
How accurate is a DCF valuation?
A DCF is only as good as its inputs — change the growth or discount rate a little and the answer can move significantly. Treat the output as an informed estimate within a range rather than a precise price. Testing several scenarios and keeping assumptions conservative both help.
What is a margin of safety?
It is the gap between intrinsic value and market price, expressed as a percentage. Analysts often prefer a company only when its estimated value sits comfortably above its price — many look for a 20–30% cushion — to allow for errors in the assumptions. It is an analytical concept, not investment advice.
Educational and informational content only. EquityTimer is not a SEBI-registered investment adviser and does not provide buy, sell or hold recommendations. Worked figures are illustrative and drawn from reported filings that may contain errors or delays; verify independently and consult a registered financial adviser before making any investment decision.