
P/E Fair Value Calculator — formula, sector multiples & worked example
💡 Key Tips
- The method is only as good as the P/E multiple you choose — pick one that fits the company’s sector.
- A defensive, slow-growth sector deserves a lower P/E; a high-growth sector justifies a higher one.
- Use a normalised EPS (a full year, not one unusual quarter) so a one-off result does not distort the answer.
- Compare the fair value with the price: a large gap is a prompt to investigate, not an instruction to act.
⚠️ Investing Cautions
- P/E fair value needs positive earnings — it cannot value a loss-making company.
- The chosen multiple is a judgement call; two sensible investors can pick different P/Es and get different answers.
- It ignores debt, cash flow and asset quality, so pair it with other methods before drawing conclusions.
- Fair value is an estimate, never a guarantee. Cross-check against other methods before deciding.
📋 Disclaimer
This calculator is provided for educational and informational purposes only and does not constitute financial or investment advice. P/E-based valuation depends heavily on the multiple chosen and is sensitive to the inputs used. Past performance is not indicative of future results. Always consult a SEBI-registered advisor and do your own research before investing.
📐 How the P/E Fair Value Is Calculated
1. The core formula
2. Why a sector-aware multiple
3. Verdict vs current price
4. Margin of Safety
P/E fair value is one of the quickest ways to estimate what a share is worth: multiply its earnings per share by a price-to-earnings multiple that fits the company’s sector. This guide explains the formula, why the sector-appropriate multiple matters so much, and walks through a worked example where the very same stock looks cheap or expensive depending on the P/E you choose. It is written for education and research only, with no buy, sell or hold advice.
What P/E fair value is
The price-to-earnings (P/E) ratio tells you how many times a company’s annual earnings the market is willing to pay for its shares. A P/E fair value calculator turns that idea around: instead of reading the multiple off the current price, it applies a multiple you consider fair to the company’s earnings, and returns an estimated price per share.
The logic is simple and intuitive. If a company earns a certain amount per share, and comparable companies typically trade at, say, twenty times their earnings, then a fair price is roughly twenty times this company’s earnings per share. It is one of the fastest sanity checks in investing — a single multiplication that gives you a reference price to compare against what the market is actually charging.
Its strength is speed and clarity; its weakness is that everything depends on the multiple you pick. Choose a multiple that suits the business and its sector, and the estimate is useful. Choose one that does not fit, and the answer can be badly off. The rest of this guide is really about choosing that multiple well.
The formula, explained
The calculation is a single step:
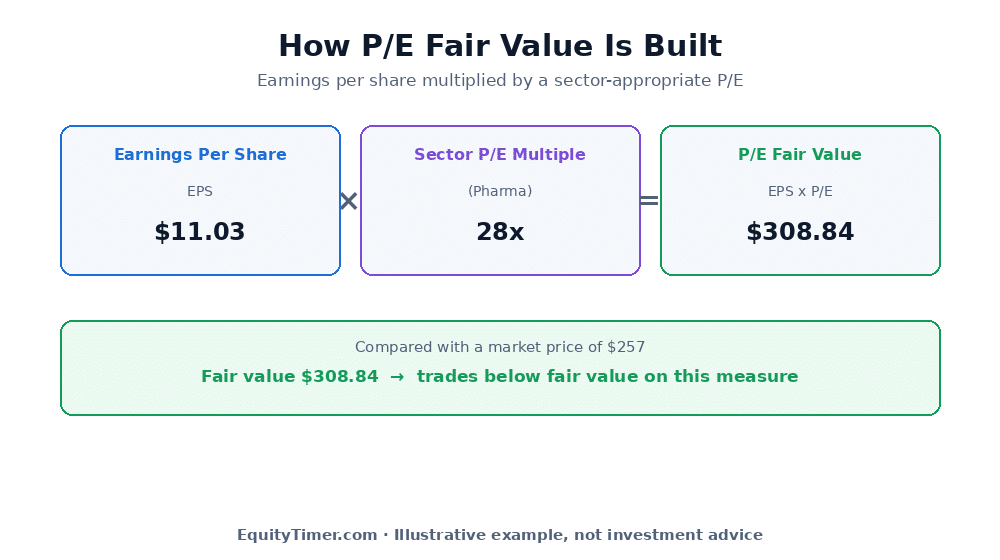
P/E Fair Value = EPS × Sector P/E
The two inputs
- EPS (earnings per share) — the company’s net profit divided by its number of shares. Use a full-year or trailing-twelve-month figure so that a single unusual quarter does not distort the result.
- Sector P/E — a price-to-earnings multiple appropriate to the company’s industry. This is the judgement part of the method, and the next tab explains why it deserves care.
Because the formula is just one multiplication, the entire quality of the answer rides on those two numbers — and especially on the multiple.
Why a sector-aware multiple
This is the heart of the method. A P/E multiple is not one fixed number that suits every company — different sectors trade at very different levels for good reasons, and using the wrong one is the most common way this calculation goes wrong.
A stable, slow-growing business — a utility or a large bank — typically trades at a low P/E, because its earnings are steady but not expected to grow quickly. A fast-growing business — a software or consumer-internet company — trades at a much higher P/E, because investors are paying today for earnings they expect to be far larger in future. Applying a utility’s multiple to a growth company would understate its value; applying a growth multiple to a utility would overstate it.
| Sector type | Typical P/E level | Why |
|---|---|---|
| PSU banks, metals | Low (8–12) | Cyclical, slow-growing earnings |
| Large-cap IT, autos | Moderate (20–25) | Steady, established growth |
| FMCG, pharma | Higher (28–48) | Defensive, consistent demand |
| New-age tech, retail | Very high (70+) | Rapid expected growth |
The figures above are illustrative ranges, not fixed rules — they shift with market conditions. The point is the principle: a fair multiple is relative to the sector. That is why the EquityTimer calculator applies a sector-aware P/E rather than a single default, and lets you adjust it when you have a better view.
A worked example
Nothing shows the importance of the multiple better than watching the same stock valued two ways. Consider a company with an EPS of $11.03, trading at a market price of about $257. (The figures are illustrative.)
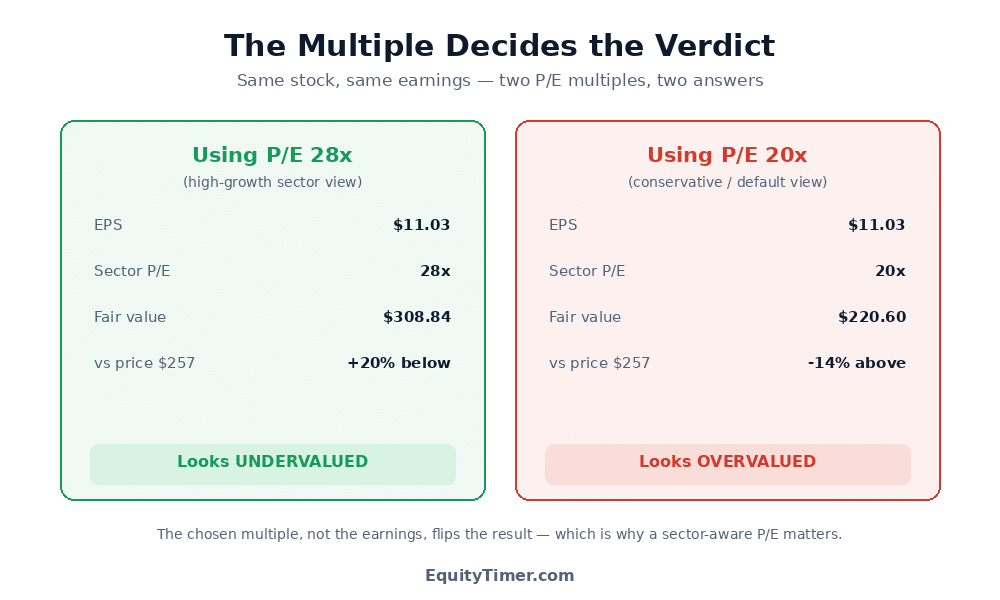
- At a sector P/E of 28x (a defensive, higher-multiple sector): 11.03 × 28 = $308.84. That is about 20% above the $257 price — the stock looks inexpensive on this view.
- At a P/E of 20x (a more conservative, general-market multiple): 11.03 × 20 = $220.60. That is about 14% below the price — the stock now looks expensive.
The earnings never changed. The only thing that moved was the multiple, and it flipped the conclusion completely. This is the single most important lesson of P/E valuation: the answer is only as sound as the multiple you choose, so that choice deserves real thought rather than a default number.
Reading the result sensibly
Once you have a fair value, compare it with the current market price. The gap between them is the useful output:
| Situation | What it suggests |
|---|---|
| Fair value well above price | The stock is cheap relative to your chosen multiple — worth understanding why |
| Fair value close to price | The market broadly agrees with your multiple |
| Fair value well below price | The market is paying more than your multiple implies — often for expected growth |
A helpful habit is to compare the stock’s own current P/E with the sector P/E you applied. If the company trades at a higher multiple than its sector, the market is already pricing in something extra — faster growth, a stronger brand, lower risk — and you should ask whether that optimism is justified. If it trades below its sector, the reverse question applies.
Because the result hinges entirely on one assumption, treat P/E fair value as a conversation starter, not a verdict. It tells you where to look, not what to conclude.
Using the EquityTimer calculator
The EquityTimer P/E Fair Value calculator handles the multiplication and, more usefully, helps you pick a sensible multiple.
- Enter the EPS, and the tool returns the fair value the moment you choose a multiple.
- Pick a sector from the list and it fills in a representative P/E for that industry — the same sector logic used by the EquityTimer automatic calculator, so the two tools agree.
- You can override the multiple at any time if you have a better estimate for the specific company.
- It compares the fair value with the current price, shows the upside or downside, and notes how the stock’s own P/E sits against the sector figure. A margin-of-safety setting gives a lower “buy below” reference, and it works across markets in the correct currency.
Because you enter the inputs yourself, you can test how the estimate moves as you try a more cautious multiple — which is exactly the habit that makes P/E valuation useful rather than misleading.
Limits and data notes
P/E fair value is fast and intuitive, but its simplicity hides real limits worth keeping in mind:
- It depends entirely on the chosen multiple. Two reasonable investors can pick different sector P/Es and reach opposite conclusions, as the worked example showed.
- It relies on a single earnings figure. If that EPS is inflated by a one-off gain or depressed by a one-off charge, the fair value inherits the distortion. A normalised, full-year EPS is safer.
- It ignores debt, cash flow and balance-sheet strength. Two companies with identical earnings look the same to it even if one is far riskier.
- It cannot value loss-making companies, and it struggles with highly cyclical businesses whose earnings swing widely from year to year.
For these reasons P/E fair value works best as one lens among several. Read it alongside a cash-flow-based estimate, an asset-based measure such as the Graham Number, and the company’s own history. When several methods point the same way, the case is stronger; when they disagree, the disagreement itself is worth investigating.
This article is for educational and informational purposes only and is not investment advice. EquityTimer is not a SEBI-registered adviser. P/E-based valuation depends heavily on the multiple chosen and on reported data that may be incomplete or change over time, and no figure here is a recommendation to buy, sell or hold any security. Always do your own research and consult a registered financial adviser before investing.
Frequently asked questions
What is P/E fair value in simple terms?
It is an estimate of a fair share price found by multiplying a company’s earnings per share by a price-to-earnings multiple that suits its sector. If a company earns a certain amount per share and similar companies trade at around twenty times earnings, a fair price is roughly twenty times this company’s EPS. It is one of the quickest reference checks in investing.
What is the P/E fair value formula?
The formula is P/E Fair Value equals EPS multiplied by the Sector P/E. EPS is earnings per share over the last twelve months, and the sector P/E is a price-to-earnings multiple appropriate to the company’s industry. The whole calculation is a single multiplication, so the quality of the answer depends heavily on the multiple you choose.
Why does the P/E multiple depend on the sector?
Different sectors grow at different speeds, so investors pay different multiples for their earnings. Stable, slow-growing businesses such as utilities or banks trade at low P/Es, while fast-growing sectors such as technology trade at much higher ones. Applying the wrong sector’s multiple is the most common way this method goes wrong, which is why a sector-aware figure matters.
Can the same stock look cheap or expensive depending on the P/E used?
Yes, and that is the key lesson of the method. In the worked example, a stock with EPS of 11.03 dollars valued at a P/E of 28 gives a fair value of about 309 dollars and looks undervalued against a 257 dollar price, but at a P/E of 20 it gives about 221 dollars and looks overvalued. The earnings did not change; only the multiple did. The answer is only as sound as the multiple chosen.
Does P/E fair value work for loss-making companies?
No. A company that is not profitable has no meaningful price-to-earnings ratio, so multiplying earnings by a P/E does not produce a sensible figure. The method also struggles with highly cyclical companies whose earnings swing sharply from year to year. For those cases, other valuation approaches are more suitable.
How is P/E fair value different from the Graham Number?
They use different inputs. P/E fair value multiplies earnings by a sector-chosen multiple, so it reflects how the market prices that industry. The Graham Number is asset-based, using earnings and book value together to produce a conservative floor. P/E fair value is faster and more market-aware; the Graham Number is stricter and ignores growth. Reading both alongside each other gives a fuller picture than either alone.
Is P/E fair value a buy signal?
No. It produces a reference figure for study, not a recommendation. A fair value above the market price simply means the stock is cheap relative to the multiple you chose; it says nothing on its own about business quality, debt or risk. EquityTimer is not a SEBI-registered adviser and the tool is for educational purposes only. Always do your own research and consult a registered adviser before investing.