
Peter Lynch (PEG) Calculator: Formula & PEG Ratio
💡 Key Tips
- A PEG of 1 is considered fair: the P/E equals the growth rate. Below 1 looks cheap for the growth, above 1 looks expensive.
- Use a realistic forward growth estimate — not last year’s one-off jump. Over-optimistic growth inflates the fair value.
- The method shines for steady growers and helps avoid judging fast-growing firms by their P/E alone.
- Only act when the price sits comfortably below fair value — that gap is your margin of safety.
⚠️ Investing Cautions
- PEG needs positive, meaningful growth — it breaks down for no-growth or shrinking companies.
- Very high growth rarely lasts; the calculator caps growth at 30% to keep the fair value grounded.
- It ignores debt, cash flow and asset quality, so pair it with other methods before drawing conclusions.
- Fair value is an estimate, never a guarantee. Cross-check against other methods before deciding.
📋 Disclaimer
This calculator is provided for educational and informational purposes only and does not constitute financial or investment advice. The PEG method depends heavily on the growth estimate used and is sensitive to the inputs. Past performance is not indicative of future results. Always consult a SEBI-registered advisor and do your own research before investing.
📐 How the Peter Lynch Fair Value Is Calculated
1. The core idea — fair P/E equals growth
2. The PEG ratio
3. Verdict vs current price
4. Margin of Safety
The Peter Lynch (PEG) method is one of the most intuitive ways to value a growing company. Instead of judging a stock by its price-to-earnings ratio alone, it links a fair P/E directly to the growth rate — the idea that a company growing earnings at 15% a year can reasonably carry a P/E around 15. This guide explains the formula, the all-important PEG ratio (where 1 is considered fair), and works through examples that show why growth changes everything. It is written for education and research only, with no buy, sell or hold advice.
Who was Peter Lynch?
Peter Lynch ran the Fidelity Magellan Fund from 1977 to 1990 and became one of the most successful fund managers in history, averaging roughly 29% a year over that period. He was known for a common-sense style of investing and for popularising a simple idea: a stock’s price-to-earnings ratio should be judged against how fast the company is growing, not in isolation.
His reasoning was straightforward. A high P/E is not automatically expensive, and a low P/E is not automatically cheap. What matters is whether the price you pay is reasonable for the growth you are getting. A company growing earnings at 30% a year can justify a much higher P/E than one growing at 5% — so comparing the two on P/E alone would be misleading.
From this came the PEG ratio (price/earnings-to-growth) and the rule of thumb that anchors this calculator: a fairly priced growth stock has a P/E roughly equal to its growth rate. Put the two side by side and you have a quick, powerful way to spot when the market is charging too much — or too little — for growth.
The formula, explained
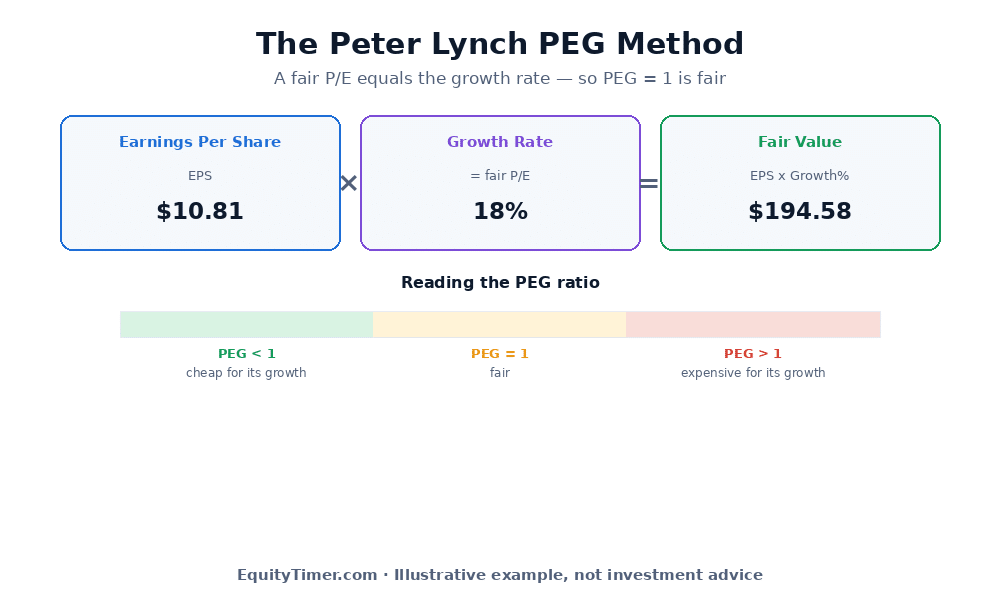
The Peter Lynch fair value takes the growth rate itself as the fair P/E, and applies it to earnings:
Fair Value = EPS × Growth%
The two inputs
- EPS (earnings per share) — the company’s net profit divided by its number of shares, ideally over a full year.
- Growth% (expected earnings growth) — the annual rate at which earnings are expected to grow. In this method the growth number is treated directly as the fair P/E, so a stock growing at 18% is valued at 18 times its earnings.
So a company earning $10.81 per share and growing at 18% has a fair value of about $194.58 — that is 10.81 multiplied by 18. The single most important choice is the growth rate, because it doubles as the multiple.
The PEG ratio — where 1 is fair
The companion to the fair value is the PEG ratio, which compares a stock’s current P/E with its growth rate:
PEG = ( Price ÷ EPS ) ÷ Growth%
The interpretation is refreshingly simple:
| PEG ratio | What it suggests |
|---|---|
| Below 1 | The price looks cheap for the growth on offer |
| Around 1 | The price is fair — P/E and growth are in balance |
| Above 1 | The price looks expensive relative to the growth |
A PEG of 1 is the reference point because it is the exact case where the P/E equals the growth rate — Lynch’s definition of a fair price. If a company trades at a P/E of 20 and grows at 20%, its PEG is 1.0 and the price fits the growth. If it grows faster than its P/E, the PEG falls below 1 and the stock looks like better value; if it grows more slowly, the PEG rises above 1 and the price looks stretched.
A worked example
Take a company with an EPS of $10.81, expected to grow earnings at about 18% a year, trading at a market price near $190. (The figures are illustrative.)
- Fair value: 10.81 × 18 = $194.58. That is just above the $190 price, so the stock looks roughly fairly valued.
- PEG ratio: its current P/E is about 17.6 (190 ÷ 10.81), and dividing that by the 18% growth gives a PEG of 0.98 — right at the “fair” line.
Both readings agree: the price is reasonable for the growth. Notice how the growth rate did double duty — it set the fair P/E of 18 and it anchored the PEG. That is the essence of the method: price is always judged in the context of growth.
If the same company were growing at only 10% instead of 18%, its fair value would fall to about $108 (10.81 × 10) and its PEG would rise well above 1 — the identical price would suddenly look expensive. The next tab shows exactly that effect.
Why growth changes everything
The clearest way to feel the power of the PEG idea is to look at three companies that all trade at the same P/E of 20 but grow at different rates.
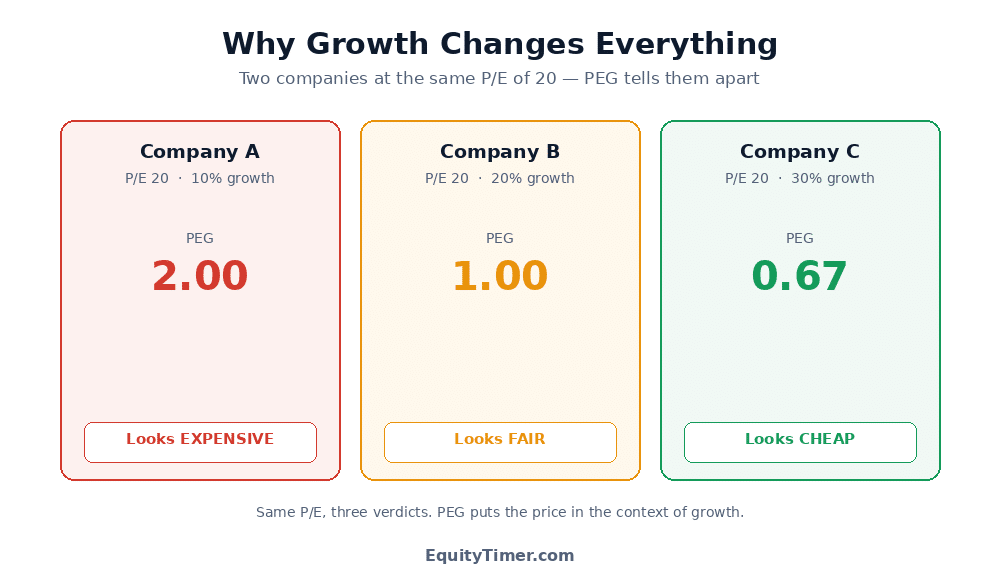
- Growing at 10%: PEG = 20 ÷ 10 = 2.0 — expensive. You are paying twenty times earnings for only ten percent growth.
- Growing at 20%: PEG = 20 ÷ 20 = 1.0 — fair. The price matches the growth exactly.
- Growing at 30%: PEG = 20 ÷ 30 = 0.67 — cheap. You are getting thirty percent growth for a twenty times multiple.
Judged on P/E alone, these three stocks look identical. Judged on PEG, they are worlds apart. This is precisely the trap Lynch wanted investors to avoid: dismissing a fast-growing company as “expensive” because of a high P/E, or embracing a slow one as “cheap” because of a low one. Growth is the missing piece of context, and the PEG method puts it back.
Using the EquityTimer calculator
The EquityTimer Peter Lynch (PEG) calculator does the arithmetic and interprets the result for you.
- Enter the EPS and an expected growth rate, and it returns the Peter Lynch fair value instantly.
- It shows the PEG ratio and reads it for you — flagging whether the price looks cheap, fair or expensive for the growth.
- It caps growth between 1% and 30%, because extreme rates rarely persist and would distort the fair value.
- It applies a margin-of-safety percentage to suggest a lower “buy below” reference, compares the fair value with the current price, and works across markets in the correct currency.
Because you enter the growth rate yourself, you can test how the valuation shifts as you try a more cautious estimate — a healthy habit, since the growth assumption drives the whole result.
Limits and data notes
The PEG method is elegant, but it rests on assumptions that deserve care:
- It depends entirely on the growth estimate. Growth is the hardest thing to forecast, and an over-optimistic rate inflates the fair value directly.
- It assumes growth continues. High growth rarely lasts for long, which is why the calculator caps it at 30% — and even that can be generous over a full cycle.
- It breaks down for low or negative growth. For a no-growth or shrinking company the PEG becomes meaningless, and the method should not be used.
- It ignores debt, cash flow and asset quality, so two companies with the same earnings and growth look identical to it even if one is far riskier.
For these reasons the Peter Lynch method works best as one lens among several, and it is especially suited to steady, profitable growers. Read it alongside a cash-flow-based estimate, an asset-based measure such as the Graham Number, and a sector-aware P/E. When several methods agree, the case is stronger; when they diverge, the disagreement itself is worth investigating.
This article is for educational and informational purposes only and is not investment advice. EquityTimer is not a SEBI-registered adviser. The PEG method depends heavily on the growth estimate used and on reported data that may be incomplete or change over time, and no figure here is a recommendation to buy, sell or hold any security. Always do your own research and consult a registered financial adviser before investing.
Frequently asked questions
What is the Peter Lynch PEG method in simple terms?
It is a way of valuing a growing company by linking a fair price-to-earnings ratio to its growth rate. The idea, from fund manager Peter Lynch, is that a company growing earnings at 15% a year can reasonably carry a P/E around 15. Fair value is calculated as earnings per share multiplied by the growth rate, and a PEG ratio of 1 is considered fair.
What is the PEG fair value formula?
Fair value equals EPS multiplied by the growth rate, where the growth rate is expressed as a whole number and treated as the fair P/E. For example, a company earning 10.81 dollars per share and growing at 18% has a fair value of about 194.58 dollars, which is 10.81 times 18. The growth rate does double duty as the multiple.
What does a PEG ratio of 1 mean?
A PEG of 1 means the price-to-earnings ratio equals the growth rate, which Peter Lynch considered a fair price. Below 1 the stock looks cheap for the growth on offer, and above 1 it looks expensive. The PEG ratio is the current P/E divided by the expected growth rate, so it puts the price directly in the context of growth.
Why is growth more important than P/E in this method?
Because a high P/E is not automatically expensive and a low one is not automatically cheap. Three companies all trading at a P/E of 20 can have very different value: one growing at 10% has a PEG of 2.0 and looks expensive, one growing at 20% has a PEG of 1.0 and looks fair, and one growing at 30% has a PEG of 0.67 and looks cheap. Growth is the missing context that P/E alone leaves out.
Does the PEG method work for slow-growing or loss-making companies?
No. The method needs real, positive earnings growth to be meaningful. For a company with little or no growth the PEG ratio balloons to meaningless levels, and for a loss-making company there is no valid P/E at all. The calculator caps growth between 1% and 30% and is best used for steady, profitable growers rather than no-growth or shrinking businesses.
What growth rate should I use?
Use a realistic forward estimate of annual earnings growth, not a one-off jump from a single strong year. Because the growth rate doubles as the fair P/E, an over-optimistic figure inflates the fair value directly. A conservative estimate is safer, and it is worth testing how the valuation changes as you lower the assumed growth. The calculator caps growth at 30%, since very high rates rarely persist.
Is the PEG fair value a buy signal?
No. It produces a reference figure and a ratio for study, not a recommendation. A fair value above the price, or a PEG below 1, simply means the stock looks reasonably priced for its growth on this one measure; it says nothing on its own about business quality, debt or risk. EquityTimer is not a SEBI-registered adviser and the tool is for educational purposes only. Always do your own research and consult a registered adviser before investing.