
EV/EBITDA Calculator
💡 Key Tips
- EV/EBITDA values the whole business including debt, so it compares fairly across companies with very different debt loads.
- The multiple should fit the sector — steady, capital-heavy businesses trade lower; asset-light growth trades higher.
- The net-debt subtraction is what P/E misses: a heavily indebted company’s equity is worth less once debt is repaid.
- Compare the fair value with the price: a large gap is a prompt to investigate, not an instruction to act.
⚠️ Investing Cautions
- EBITDA ignores real costs — interest, tax and the capital spending needed to keep the business running.
- The chosen multiple is a judgement call; different investors can pick different multiples and reach different answers.
- For financial companies (banks, insurers) EV/EBITDA is not appropriate — debt is part of their operations.
- Fair value is an estimate, never a guarantee. Cross-check against other methods before deciding.
📋 Disclaimer
This calculator is provided for educational and informational purposes only and does not constitute financial or investment advice. EV/EBITDA valuation depends heavily on the multiple chosen and is sensitive to the inputs used. Past performance is not indicative of future results. Always consult a SEBI-registered advisor and do your own research before investing.
📐 How the EV/EBITDA Fair Value Is Calculated
1. The core formula
2. Why it values the whole business
3. From enterprise value to equity
4. Verdict & Margin of Safety
EV/EBITDA is a valuation method that values the whole business, including its debt, rather than just the slice belonging to shareholders. That makes it one of the fairest ways to compare companies carrying very different debt loads — something the popular P/E ratio cannot do well. This guide explains the formula, what each term means, and works through an example that shows why debt changes the answer. It is written for education and research only, with no buy, sell or hold advice.
What EV/EBITDA is
EV/EBITDA compares a company’s enterprise value (EV) — the value of the entire business — with its EBITDA, a measure of operating earnings. Used as a valuation tool, it works in reverse: you apply a sensible EV/EBITDA multiple to a company’s EBITDA to estimate what the whole business is worth, then adjust for debt and cash to arrive at a fair value per share.
What sets it apart from the familiar P/E ratio is the word enterprise. The P/E ratio looks only at the portion of a company owned by shareholders. Enterprise value looks at the whole thing — the part funded by shareholders and the part funded by lenders. That distinction is the reason professionals reach for EV/EBITDA when debt is part of the story.
Because it accounts for borrowings directly, EV/EBITDA is especially useful for capital-heavy, indebted industries such as telecoms, utilities, and infrastructure, and for comparing two companies that earn similar profits but carry very different amounts of debt.
The formula, explained
The fair value per share is calculated in a short chain of steps:
Value per Share = ( EBITDA × Multiple − Net Debt ) ÷ Shares
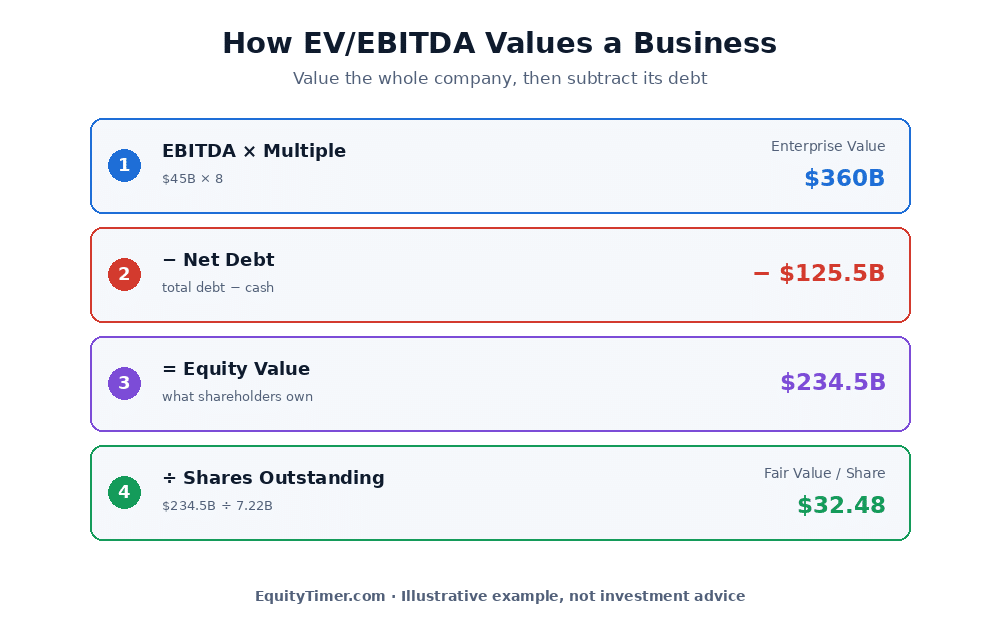
Reading it step by step:
- EBITDA × Multiple gives the enterprise value — what the entire business is worth to all its funders.
- − Net Debt removes what is owed to lenders, leaving the equity value — the part that belongs to shareholders.
- ÷ Shares spreads that equity value across every share to give the fair value per share.
The whole method hinges on two ideas the next tab unpacks: what EBITDA measures, and what net debt represents.
EBITDA and Net Debt, defined
EBITDA
EBITDA stands for earnings before interest, tax, depreciation and amortisation. It strips out four things from profit: interest (which depends on how the company is financed), tax (which varies by jurisdiction), and depreciation and amortisation (which are non-cash accounting charges). What remains is a clean view of the cash-generating power of the core operations, before financing and accounting choices cloud the picture.
That neutrality is exactly why EV/EBITDA pairs EBITDA with enterprise value. Because EBITDA is measured before interest, it reflects the earnings available to all funders — shareholders and lenders alike — which is the same group that enterprise value represents.
Net Debt
Net debt is total debt minus cash. The logic is simple: a company’s cash could be used to pay down its borrowings, so only the debt left over after using up the cash is a true burden. A company with $60 billion of debt but $10 billion of cash has net debt of $50 billion.
Net debt can even be negative. When a company holds more cash than debt — a “net cash” position — subtracting a negative figure adds to the equity value, because that surplus cash belongs to shareholders too. This is a real-world detail that a P/E ratio, looking only at earnings, completely overlooks.
A worked example
Take a large, debt-heavy telecom as an illustration. Suppose it has an EBITDA of $45 billion, carries net debt of $125.5 billion, and has 7.22 billion shares outstanding, trading near $29. Using a telecom EV/EBITDA multiple of 8:
- Enterprise value: 45 × 8 = $360 billion.
- Equity value: 360 − 125.5 = $234.5 billion.
- Per share: 234.5 ÷ 7.22 ≈ $32.48.
At about $29, the shares would sit a little below that estimate. But notice the size of the debt step: the business is worth $360 billion as a whole, yet $125.5 billion of that — more than a third — belongs to lenders, not shareholders. Subtracting it is what turns a $360 billion enterprise into $234.5 billion of equity.
A P/E-based approach would never show that subtraction. It would value the earnings and stop, quietly ignoring the enormous debt sitting on the balance sheet. That is the gap EV/EBITDA is built to close — and the next tab makes the effect impossible to miss.
Why debt matters
The clearest way to see the value of EV/EBITDA is to compare two companies that are identical in every way except their debt. Suppose both earn EBITDA of $10 billion, both have 1 billion shares, and both trade at a 10× multiple — so both have an enterprise value of $100 billion.
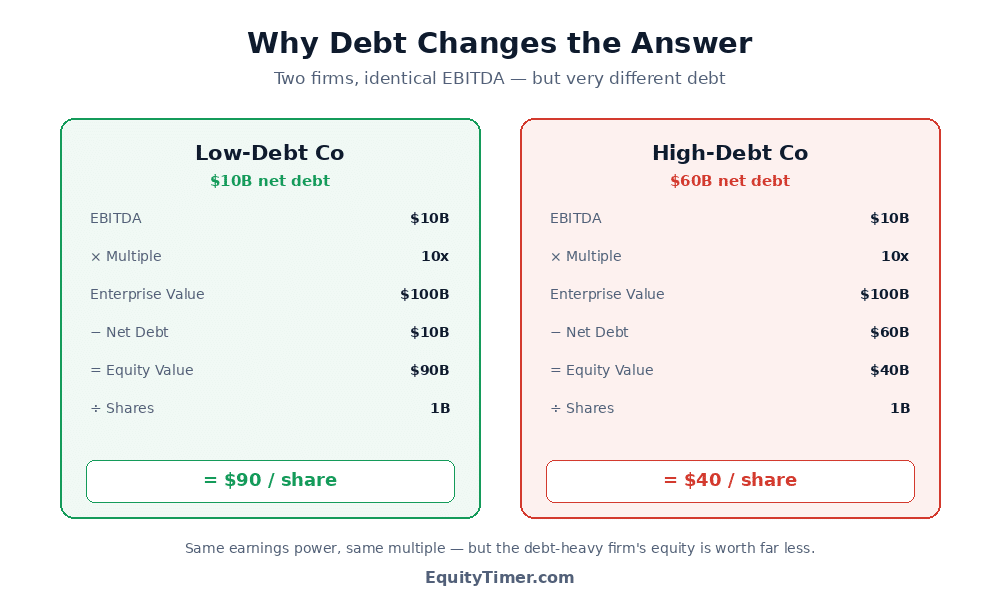
- The low-debt company has $10 billion of net debt. Its equity value is 100 − 10 = $90 billion, or $90 per share.
- The high-debt company has $60 billion of net debt. Its equity value is 100 − 60 = $40 billion, or $40 per share.
Same earnings power, same enterprise value, same multiple — yet one share is worth more than twice the other. The only difference is debt, and EV/EBITDA captures it directly. A P/E ratio, comparing only earnings, would make these two look far more alike than they really are.
This is why analysts favour EV/EBITDA whenever leverage varies across the companies being compared. It puts every business on the same footing before debt, then lets the debt itself explain the difference in what shareholders actually own.
Using the EquityTimer calculator
The EquityTimer EV/EBITDA calculator handles the whole chain and helps with the inputs that are otherwise fiddly to gather.
- Enter EBITDA, net debt and shares outstanding, and it returns the fair value per share instantly.
- Pick a sector and it fills in a representative EV/EBITDA multiple; you can override it with your own.
- It shows the full build-up — enterprise value, the net-debt subtraction, equity value, and per-share value — so the logic is transparent rather than a black box.
- It flags how large the debt load is relative to enterprise value, handles the net-cash case correctly, applies a margin-of-safety “buy below” figure, and works across markets in the correct currency.
When you upload a data file, the tool can derive EBITDA, net debt and shares for you, so you can focus on choosing a sensible multiple rather than hunting for figures.
Limits and data notes
EV/EBITDA is powerful for comparisons, but it has real blind spots worth keeping in mind:
- It depends on the chosen multiple. Different investors can pick different sector multiples and reach different answers, so the figure is only as sound as that assumption.
- EBITDA ignores real costs. By excluding interest, tax, and the depreciation that stands in for capital spending, it can flatter businesses that need heavy ongoing investment just to stay competitive.
- It says nothing about capital efficiency. Two firms with the same EBITDA can differ hugely in how much they must reinvest, and EV/EBITDA treats them the same.
- It does not fit financial companies such as banks and insurers, where debt is part of the operating model rather than a financing decision.
For these reasons EV/EBITDA works best as one lens among several, and it is at its strongest when comparing companies within the same industry. Read it alongside a cash-flow-based estimate, an earnings-based measure such as a P/E fair value, and the company’s own history. When several methods agree, the case is stronger; when they diverge, the disagreement itself is worth investigating.
This article is for educational and informational purposes only and is not investment advice. EquityTimer is not a SEBI-registered adviser. EV/EBITDA valuation depends heavily on the multiple chosen and on reported data that may be incomplete or change over time, and no figure here is a recommendation to buy, sell or hold any security. Always do your own research and consult a registered financial adviser before investing.
Frequently asked questions
What is EV/EBITDA in simple terms?
It is a way of valuing the whole business, including its debt, rather than just the shareholders’ portion. You apply a sector-appropriate multiple to a company’s EBITDA to estimate its enterprise value, subtract net debt to get the equity value, then divide by the number of shares to reach a fair value per share. It is especially useful for comparing companies that carry very different debt loads.
What is the EV/EBITDA fair value formula?
Value per share equals EBITDA times the multiple, minus net debt, divided by shares outstanding. EBITDA times the multiple gives the enterprise value, subtracting net debt gives the equity value, and dividing by shares spreads that across every share. The whole business is valued first, then debt is removed to find what belongs to shareholders.
What does EBITDA stand for?
EBITDA stands for earnings before interest, tax, depreciation and amortisation. It removes interest, tax and the non-cash charges of depreciation and amortisation from profit, leaving a cleaner view of the cash-generating power of the core operations before financing and accounting choices are taken into account.
What is net debt and why is it subtracted?
Net debt is total debt minus cash, because a company could use its cash to pay down borrowings, so only the debt left over is a real burden. It is subtracted from enterprise value because shareholders own the business only after its debts are settled. The larger the net debt, the smaller the equity value that remains for shareholders.
Why is EV/EBITDA better than P/E for comparing debt loads?
Because the P/E ratio looks only at the shareholders’ portion and ignores debt, while EV/EBITDA values the whole business and then subtracts debt explicitly. Two companies with identical earnings but very different debt can have equity worth twice as much for one as the other, and EV/EBITDA captures that difference where a P/E ratio would make them look almost the same.
Can net debt be negative?
Yes. When a company holds more cash than debt it is in a net cash position, and net debt is negative. Subtracting a negative figure adds to the equity value, because that surplus cash belongs to shareholders. This is a real detail that a P/E ratio overlooks, and the calculator handles it correctly, showing the cash as an addition to equity value.
Is EV/EBITDA a buy signal?
No. It produces a reference figure for study, not a recommendation. A fair value above the price simply means the shares look inexpensive on this one measure, and EBITDA itself ignores interest, tax and capital spending, so it should be read alongside other methods. EquityTimer is not a SEBI-registered adviser and the tool is for educational purposes only. Always do your own research and consult a registered adviser before investing.