
Dividend Discount Model (DDM) Calculator — Gordon Growth Model
💡 Key Tips
- The model fits mature companies with steady, growing dividends — dividend aristocrats are the classic example.
- The gap between r and g drives everything. A small change in either can swing the value sharply, so choose both with care.
- Use a sustainable long-term growth rate, not a recent spike — dividends rarely grow faster than the business for long.
- Only act when the price sits comfortably below fair value — that gap is your margin of safety.
⚠️ Investing Cautions
- The model is only valid when r is greater than g. If growth meets or exceeds the required return, the formula breaks down.
- It is very sensitive to its inputs — a tiny change in r or g can move the fair value a long way.
- It cannot value a non-dividend payer, and assumes the dividend grows steadily forever, which rarely holds exactly.
- Fair value is an estimate, never a guarantee. Cross-check against other methods before deciding.
📋 Disclaimer
This calculator is provided for educational and informational purposes only and does not constitute financial or investment advice. The dividend discount model depends heavily on the required return and growth assumptions and is highly sensitive to them. Past performance is not indicative of future results. Always consult a SEBI-registered advisor and do your own research before investing.
📐 How the DDM Fair Value Is Calculated
1. The Gordon Growth formula
2. Next year’s dividend
3. Why r must exceed g
4. Verdict & Margin of Safety
The Dividend Discount Model (DDM), in its popular Gordon Growth form, values a share by the dividends it is expected to pay. The logic is elegant: if you own a stock for its dividends, the stock is worth the stream of all its future dividends, valued in today’s money. This guide explains the formula, why the required return must exceed the growth rate, and works through an example that shows just how sensitive the answer is to its inputs. It is written for education and research only, with no buy, sell or hold advice.
What the Dividend Discount Model is
The Dividend Discount Model values a share as the present value of every dividend it will ever pay. The idea rests on a simple truth: if a company returns cash to its owners through dividends, then a share is worth the whole future stream of those payments, discounted back to what they are worth today.
Adding up an infinite stream of dividends sounds impossible, but a clever shortcut makes it manageable. If dividends are assumed to grow at a steady rate forever, the entire stream collapses into one short formula — the Gordon Growth Model, named after economist Myron Gordon. That is the version this calculator uses, and it is the one most investors mean when they say “DDM”.
Because it depends on a predictable, growing dividend, the model is best suited to mature companies with a long, stable payout history — think consumer staples and utilities. For a young company that pays no dividend, the model simply does not apply, and it is skipped.
The formula, explained
The Gordon Growth version of the DDM is compact:
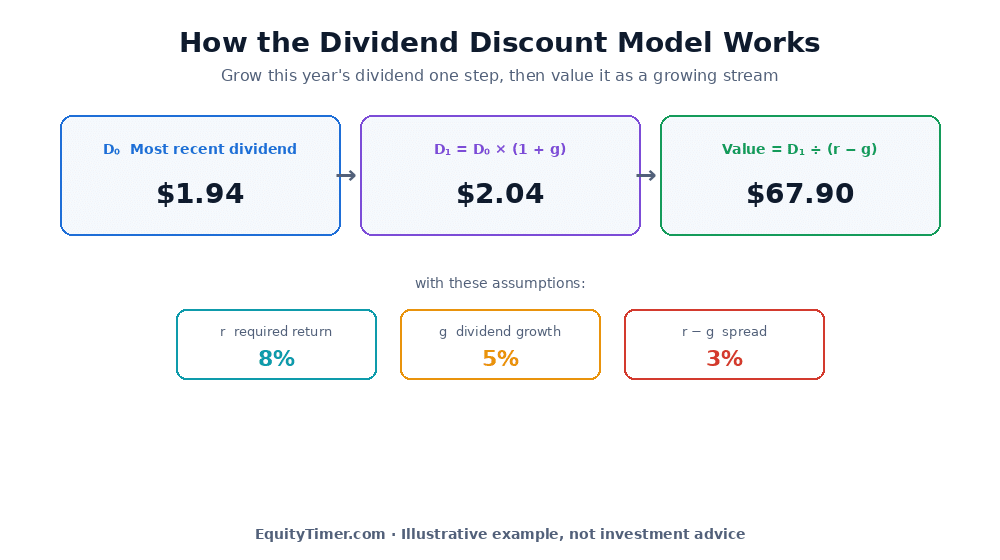
Value = D₁ ÷ ( r − g )
The first step is to find next year’s dividend from this year’s:
D₁ = D₀ × ( 1 + g )
Reading the two together:
- D₀ is the most recent dividend, and D₁ grows it forward one year at the growth rate.
- Dividing D₁ by r − g — the gap between the required return and the dividend growth rate — values the whole future stream of growing dividends as a single figure in today’s money.
The result is the fair value per share. Everything then hinges on three inputs, which the next tab unpacks.
The three inputs
D₀ — the most recent dividend
D₀ is the annual dividend per share the company most recently paid. It is the starting point the whole model grows from, so it should reflect the regular, sustainable dividend rather than a one-off special payout.
g — the dividend growth rate
g is the rate at which the dividend is expected to grow each year, forever. This is the hardest input to judge, and it should be a sustainable long-term rate — often close to the company’s expected earnings growth, and rarely much above the long-run growth of the wider economy. A dividend cannot grow faster than its business indefinitely.
r — the required rate of return
r is the annual return you require for owning the share, given its risk. A higher required return produces a lower fair value, because you are demanding more compensation for the same dividends. It reflects both the safe rate of return available elsewhere and the extra return you want for taking on the risk of this particular stock.
A worked example
Take a mature, dividend-paying company as an illustration. Suppose its most recent annual dividend was D₀ = $1.94, you require a return of r = 8%, and you expect the dividend to grow at g = 5% a year. The share trades near $70.
- Next year’s dividend: D₁ = 1.94 × (1 + 0.05) = $2.04.
- The spread: r − g = 8% − 5% = 3%.
- Fair value: 2.04 ÷ 0.03 ≈ $67.90.
At about $70, the share would sit just above that estimate, so it looks roughly fairly valued on this measure. The dividend yield at that price is about 2.8%.
Notice how much rests on that 3% spread. The dividend of $2.04 is modest, yet it supports a $67.90 valuation because it is treated as a stream that grows forever. Shrink or widen the gap between r and g even slightly, and the answer moves a great deal — which is exactly what the next tab demonstrates.
Why the r − g gap matters
The DDM’s greatest strength — and its biggest danger — is how much rides on the gap between the required return and the growth rate. Keep the dividend and growth fixed, and change only the required return, and the fair value swings dramatically.
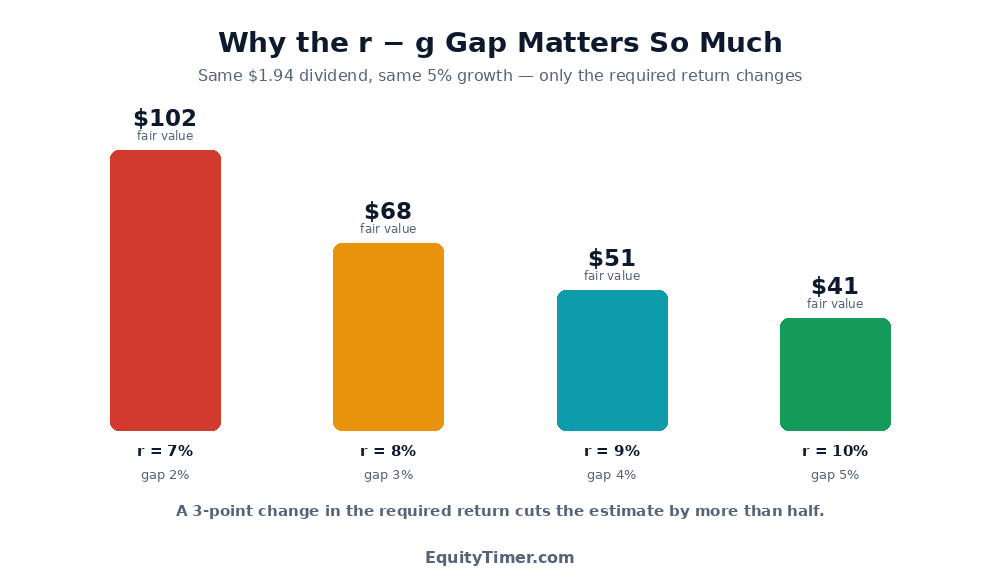
- At r = 7% (a 2% spread), the value is about $102.
- At r = 8% (a 3% spread), it falls to about $68.
- At r = 9% (a 4% spread), it drops to about $51.
- At r = 10% (a 5% spread), it is just $41.
The same dividend supports valuations ranging from $41 to $102, purely because of the assumed return. As the gap between r and g narrows toward zero, the value races toward infinity; that is why the model requires r to be greater than g. If growth met or exceeded the required return, the formula would return a negative or infinite value — a signal that the steady-growth assumption has broken down.
The lesson is not that the model is broken, but that it demands careful, conservative inputs. Small differences in judgement produce large differences in the answer, so the fair value is best read as a range, not a precise figure.
Using the EquityTimer calculator
The EquityTimer DDM calculator handles the arithmetic and guards the assumptions that make or break the model.
- Enter the most recent dividend (D₀), your required return (r) and the dividend growth rate (g), and it returns the fair value instantly.
- It shows the full build-up — D₀, next year’s D₁, the r − g spread, and the resulting value — so the logic is transparent.
- It flags an invalid setup: if g is set at or above r, it warns that the formula cannot be used, and it skips the model entirely for a company with no dividend.
- It highlights when the r − g gap is uncomfortably small, applies a margin-of-safety “buy below” figure, shows the dividend yield, and works across markets in the correct currency.
Because the model is so sensitive, the calculator makes it easy to try a more cautious required return or a lower growth rate and watch how the fair value responds — a habit worth building.
Limits and data notes
The DDM is elegant, but its assumptions are strong and deserve care:
- It only works for dividend payers. A company that pays no dividend, or an irregular one, cannot be valued this way.
- It assumes a single, constant growth rate forever, which few companies truly follow. Real dividends grow in fits and starts, and fast early growth eventually slows.
- It is extremely sensitive to the required return and growth rate, as the previous tab showed — small input changes swing the answer widely.
- It breaks down when g approaches r, producing implausibly high or invalid values, so it suits steady, moderate growers far better than rapid ones.
For these reasons the DDM works best as one lens among several, and it is at its most reliable for mature, stable dividend payers. Read it alongside a cash-flow-based estimate, an earnings-based measure such as a P/E fair value, and the company’s own dividend history. When several methods agree, the case is stronger; when they diverge, the disagreement itself is worth investigating.
This article is for educational and informational purposes only and is not investment advice. EquityTimer is not a SEBI-registered adviser. The dividend discount model depends heavily on the required return and growth assumptions and is highly sensitive to them, and no figure here is a recommendation to buy, sell or hold any security. Always do your own research and consult a registered financial adviser before investing.
Frequently asked questions
What is the Dividend Discount Model in simple terms?
It is a way of valuing a share by the dividends it is expected to pay. The idea is that if you own a stock for its dividends, the share is worth the whole stream of its future dividends valued in today’s money. The popular Gordon Growth version assumes the dividend grows at a steady rate forever, which collapses that infinite stream into one short formula.
What is the DDM formula?
The Gordon Growth formula is Value equals D1 divided by r minus g, where D1 is next year’s expected dividend, r is the required rate of return and g is the steady dividend growth rate. Next year’s dividend is found from the most recent one as D1 equals D0 times one plus g. Dividing by the gap between r and g values the whole stream of growing dividends as a single figure.
What are D0 and D1 in the dividend discount model?
D0 is the most recent annual dividend per share the company has paid, and D1 is next year’s expected dividend. D1 is calculated by growing D0 forward one year at the growth rate, so D1 equals D0 times one plus g. The model uses D1 in the numerator because it values the dividends expected from next year onward.
Why must the required return be greater than the growth rate?
Because the formula divides by r minus g. If the growth rate met or exceeded the required return, that gap would be zero or negative, and the value would be infinite or negative, which is meaningless. As the gap narrows toward zero the value races upward, so the model is only valid when r is greater than g and works best when there is a healthy gap between them.
Why is the DDM so sensitive to its inputs?
Because the valuation depends on the small gap between the required return and the growth rate. Keeping the same dividend and growth, a required return of 7 percent can give a value near 102 dollars while 10 percent gives about 41 dollars. A change of a few percentage points can more than halve the estimate, so the fair value is best read as a range and the inputs chosen conservatively.
Can the DDM value a company that pays no dividend?
No. The model values the stream of dividends, so with no dividend there is nothing to discount and the model is skipped. It also struggles with irregular or unpredictable dividends. For companies that pay little or no dividend, an earnings-based or cash-flow-based method is more appropriate than the dividend discount model.
Is the DDM fair value a buy signal?
No. It produces a reference figure for study, not a recommendation. Because the model is highly sensitive to the required return and growth assumptions, a value above the price simply means the shares look inexpensive under those specific inputs. EquityTimer is not a SEBI-registered adviser and the tool is for educational purposes only. Always do your own research and consult a registered adviser before investing.