
Reverse DCF Calculator — What Growth Is the Market Pricing In?
💡 Key Tips
- The reverse DCF flips valuation around: it starts from the price and solves for the growth the market must be expecting, so you judge an expectation instead of guessing one.
- The real test is the comparison: set the implied growth against the company’s history and its industry. Is that rate plausible for a decade?
- When implied growth sits well below what the company has delivered, expectations look modest; when it sits well above, they look demanding.
- Great for high-growth names, where it exposes exactly how much future growth is already in the price.
⚠️ Investing Cautions
- The implied growth is only as good as r and the terminal assumptions — a higher discount rate implies a higher required growth, and vice versa.
- Past growth does not guarantee future growth. A low implied number is not automatically “cheap” if the business is slowing.
- It uses a single 10-year growth rate then a terminal fade; real earnings paths are lumpier than that.
- Best for profitable, positive-EPS companies. It is unreliable when earnings are negative or highly erratic.
📋 Disclaimer
This calculator is provided for educational and informational purposes only and does not constitute financial or investment advice. The reverse DCF depends heavily on the discount rate and terminal assumptions and is sensitive to them. Past performance is not indicative of future results. Always consult a SEBI-registered advisor and do your own research before investing.
📐 How the Reverse DCF Works
1. A normal DCF, run backwards
2. Solving for the implied growth
3. The comparison is the whole point
4. How to read it
A reverse DCF turns valuation on its head. Instead of feeding in a growth rate to work out what a stock is worth, it starts from today’s market price and works backwards to find the growth rate the market must be expecting. Comparing that implied figure with what the company has actually delivered tells you whether the price rests on modest assumptions or demanding ones. This guide explains how it works, walks through an example, and shows why the comparison matters more than the number itself. It is written for education and research only, with no buy, sell or hold advice.
What a reverse DCF is
A standard discounted cash flow (DCF) model asks: given a growth rate I assume, what is this company worth? You feed in a growth estimate, discount the future earnings back to today, and out comes a fair value. The trouble is that the answer is only ever as good as the growth rate you guessed — and reasonable people can guess very differently.
A reverse DCF sidesteps that guesswork. It takes the one number nobody has to estimate — today’s market price — and runs the model backwards to find the growth rate that would justify it. The output is not a value but an implied growth rate: the pace at which earnings must grow for the current price to make sense.
That shift changes the question you are answering. Instead of “what is this stock worth?” you ask “what is the market already expecting, and is that realistic?” It is often a more honest place to start, because it puts the market’s assumptions on the table where you can judge them.
The same equation, flipped
Both models use the identical discounted-cash-flow equation. The only difference is which side you treat as known:
Price = Σ [ EPS × (1 + g)ⁿ ÷ (1 + r)ⁿ ] + Terminal Value
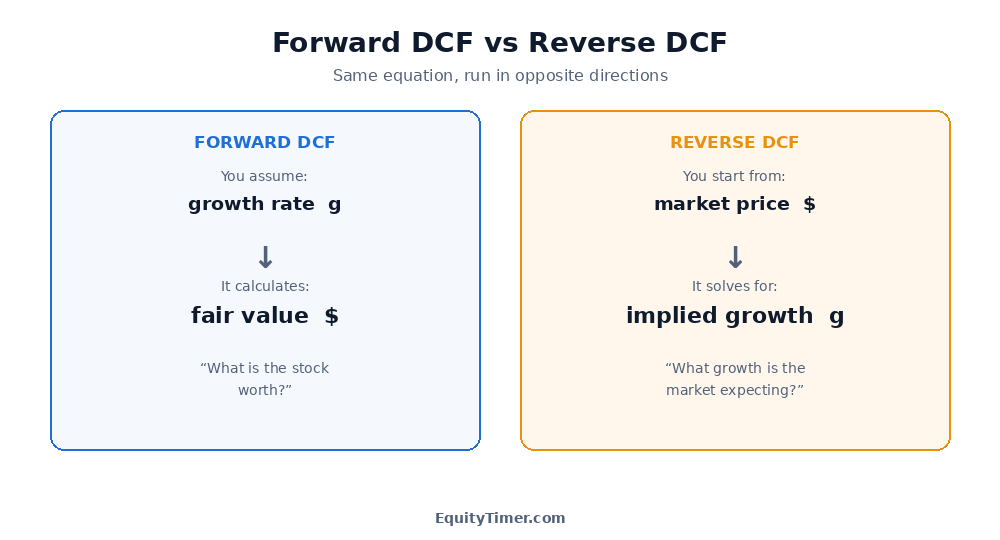
- In a forward DCF, growth g is the input and price is the output.
- In a reverse DCF, price is the input and growth g is the output.
Everything else stays the same: earnings per share (EPS) are the starting cash flow, r is the discount rate that brings future earnings back to today’s money, and a terminal value captures the years beyond the explicit forecast. Flip which variable you solve for, and the same machinery answers a completely different question.
How it solves for growth
There is no tidy algebra to isolate the growth rate in a DCF — it appears compounded across many years. So a reverse DCF finds it by searching rather than solving directly.
The method is simple and reliable:
- Pick a trial growth rate and run a normal DCF to get a value.
- If that value comes out above the market price, the trial growth was too high; if below, too low.
- Narrow the range and try again, repeating until the modelled value matches the price.
This repeated halving — testing, comparing, narrowing — homes in on the answer within a fraction of a percent in a handful of steps. The calculator does it instantly. The growth rate it lands on is the implied growth: earnings grow at that rate for a ten-year explicit window, after which a terminal value carries the business forward at a modest perpetual rate.
A worked example
Take a fast-growing chip maker as an illustration — the kind of stock where a reverse DCF is most revealing. Suppose it earns EPS of $4.90, trades at $180, and you use a discount rate of 10% with a terminal growth of 3%.
Running the model backwards, the growth rate that makes a ten-year DCF equal $180 is about 15% a year. That is the market’s implied expectation: earnings roughly doubling and then some over the next decade.
| Input | Value |
|---|---|
| Starting EPS | $4.90 |
| Current price | $180 |
| Discount rate (r) | 10% |
| Terminal growth (tg) | 3% |
| Implied EPS growth | ~15% per year |
On its own, “15%” means little. The value comes from asking whether a company can plausibly grow earnings at that pace for ten years — which is exactly what the comparison tab does next.
The comparison is the point
An implied growth rate only becomes useful when you set it against something. The most natural yardstick is the company’s own historical growth.
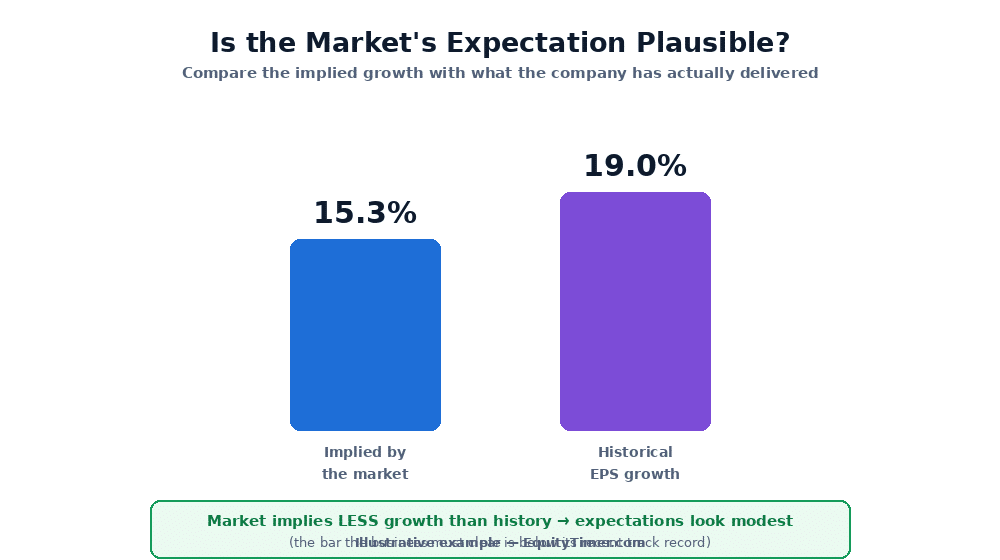
In our example the market implies about 15% growth, while the company has historically grown earnings closer to 19%. Because the implied figure sits below the track record, the expectations baked into the price look modest — the business would only need to keep pace with a slower version of its past to justify the price.
Turn it around and the reading flips. If a reverse DCF implied 30% growth for a company that has historically grown at 12%, the price would be leaning on demanding assumptions — the business would have to accelerate sharply for a decade. That is the signal a reverse DCF is built to surface.
The discount rate you choose shifts the implied figure, so it is worth testing a range rather than trusting a single number:
| Discount rate (r) | Implied growth |
|---|---|
| 8% | ~10% |
| 9% | ~13% |
| 10% | ~15% |
| 11% | ~18% |
| 12% | ~20% |
A higher required return raises the growth the market must be expecting to justify the same price. That is why a reverse DCF is best read as a range and a comparison, not a single precise figure.
Using the EquityTimer calculator
The EquityTimer Reverse DCF calculator does the backward search for you and frames the result as a comparison.
- Enter the current price and EPS, set the discount rate and terminal growth, and it returns the implied EPS growth instantly.
- It places the implied figure next to the company’s historical growth and labels the expectations as modest, in line, or demanding.
- It shows the full build-up — price, starting EPS, the discount and terminal assumptions, and the resulting implied growth versus history.
- It guards the maths: the discount rate must exceed the terminal rate, and it flags that the tool needs positive earnings to be meaningful.
Because the implied growth moves with the discount rate, the calculator makes it easy to try a few required returns and watch the implied figure shift — the honest way to use the tool.
Limits and data notes
A reverse DCF is a powerful way to interrogate a price, but its assumptions still bind:
- It is sensitive to the discount rate and terminal assumptions. As the table showed, changing the required return moves the implied growth noticeably, so a single number is less useful than a range.
- It needs positive, reasonably stable earnings. For loss-making or wildly erratic companies, growing EPS forward from a negative or distorted base gives meaningless results.
- It assumes a single growth rate across the explicit window before a terminal fade; real earnings paths are lumpier, with acceleration and slowdown.
- A low implied growth is not automatically “cheap.” If a business is genuinely deteriorating, even modest implied growth may be too optimistic.
Used well, the reverse DCF is less a valuation engine than a reality check: it converts a price into an expectation you can argue with. Read it alongside a forward DCF, an earnings-based measure such as a P/E fair value, and the company’s competitive position. When the implied growth looks easily achievable, the price rests on solid ground; when it looks heroic, the burden of proof is high.
This article is for educational and informational purposes only and is not investment advice. EquityTimer is not a SEBI-registered adviser. The reverse DCF depends heavily on the discount rate and terminal assumptions and is sensitive to them, and no figure here is a recommendation to buy, sell or hold any security. Always do your own research and consult a registered financial adviser before investing.
Frequently asked questions
What is a reverse DCF?
It is a discounted cash flow model run backwards. Instead of assuming a growth rate to calculate a fair value, it starts from the current market price and solves for the growth rate the market must be expecting. The output is an implied growth rate, which you then compare with the company’s actual history to judge whether the price rests on modest or demanding assumptions.
How is a reverse DCF different from a normal DCF?
They use the same equation but solve for different things. A forward DCF takes a growth rate as the input and produces a fair value as the output. A reverse DCF takes the market price as the input and produces the implied growth rate as the output. One asks what the stock is worth; the other asks what growth the market is already expecting.
What does implied growth mean?
Implied growth is the rate at which earnings would have to grow to justify the current share price under your discount and terminal assumptions. It is the market’s built-in expectation, extracted from the price. A reverse DCF exists to reveal this number so you can test whether that expected pace of growth is realistic for the company.
How does a reverse DCF solve for the growth rate?
Because the growth rate cannot be isolated with algebra, the model searches for it. It tries a growth rate, runs a normal DCF, and checks whether the resulting value is above or below the price, then narrows the range and repeats until the value matches the price. This repeated halving converges on the implied growth within a fraction of a percent in a few steps.
Why compare implied growth to historical growth?
Because an implied growth rate means little on its own. Setting it against what the company has actually delivered shows whether the market’s expectations are modest or demanding. If the implied rate sits below the historical rate, the price leans on cautious assumptions; if it sits well above, the business must accelerate to justify the price, which is a higher bar to clear.
Does the discount rate change the implied growth?
Yes, significantly. A higher discount rate means the market must be expecting faster growth to justify the same price, so the implied growth rises. For example, the same price and earnings can imply roughly 10 percent growth at an 8 percent discount rate but around 20 percent at a 12 percent rate. This is why a reverse DCF is best read as a range across several discount rates rather than a single figure.
Is a low implied growth a buy signal?
No. A low implied growth only means the price is not demanding much future growth; it is not a recommendation, and it is not automatically cheap if the business is deteriorating. The reverse DCF is a reality check on expectations, not a verdict. EquityTimer is not a SEBI-registered adviser and the tool is for educational purposes only. Always do your own research and consult a registered adviser before investing.