
CAGR Calculator: CAGR vs Absolute Return Explained
💡 Key Tips
- CAGR smooths out yearly ups and downs into one steady annual rate — ideal for comparing two investments held for different durations.
- Always compare a fund or stock’s CAGR against a benchmark index CAGR (e.g. NIFTY 50) over the same period.
- Use Absolute Return for periods under 1 year, and CAGR for multi-year periods.
- A rough rule of thumb: money doubles in about 72 ÷ CAGR years (Rule of 72).
⚠️ Investing Cautions
- CAGR hides volatility — a 12% CAGR journey can include years of deep drawdowns.
- CAGR assumes a single lump sum with no additions or withdrawals. For SIPs or multiple cash flows, XIRR is the correct measure.
- Point-to-point CAGR is sensitive to start and end dates; measuring from a market bottom to a peak can be misleading.
- CAGR shown here is pre-tax and pre-expenses; real returns will be lower.
📋 Disclaimer
This calculator is provided for educational and informational purposes only. It does not constitute financial, investment, or trading advice. Trading and investing carry substantial risk of loss and are not suitable for every investor. Past performance is not indicative of future results. Always consult a qualified financial advisor and conduct your own due diligence before making any trading or investment decisions.
📐 Formulas Explained
1. CAGR — Compound Annual Growth Rate
2. Absolute Return
3. Investment Multiple
Two investments can both have doubled your money and still be nothing alike — one took two years, the other took twenty. Absolute return tells you how much you gained; CAGR tells you how fast. This guide explains both measures in plain English, works through the formulas step by step, shows when each one is the right tool, and walks you through the free EquityTimer CAGR & Absolute Return Calculator. Educational content only — no buy, sell or hold advice.
Understanding compound annual growth rate
CAGR stands for Compound Annual Growth Rate. It answers a single question: if this investment had grown by the same percentage every single year, what would that percentage have been? It takes a messy, uneven journey — a good year, a flat year, a bad year — and expresses the whole thing as one smooth annual rate.
Both words in the middle of the name carry weight. Compound means each year’s growth is calculated on the value already reached, not on the original amount, so gains build on gains. Annual means the answer is always expressed per year, which is what makes two investments held for different lengths of time comparable at all.
A quick illustration
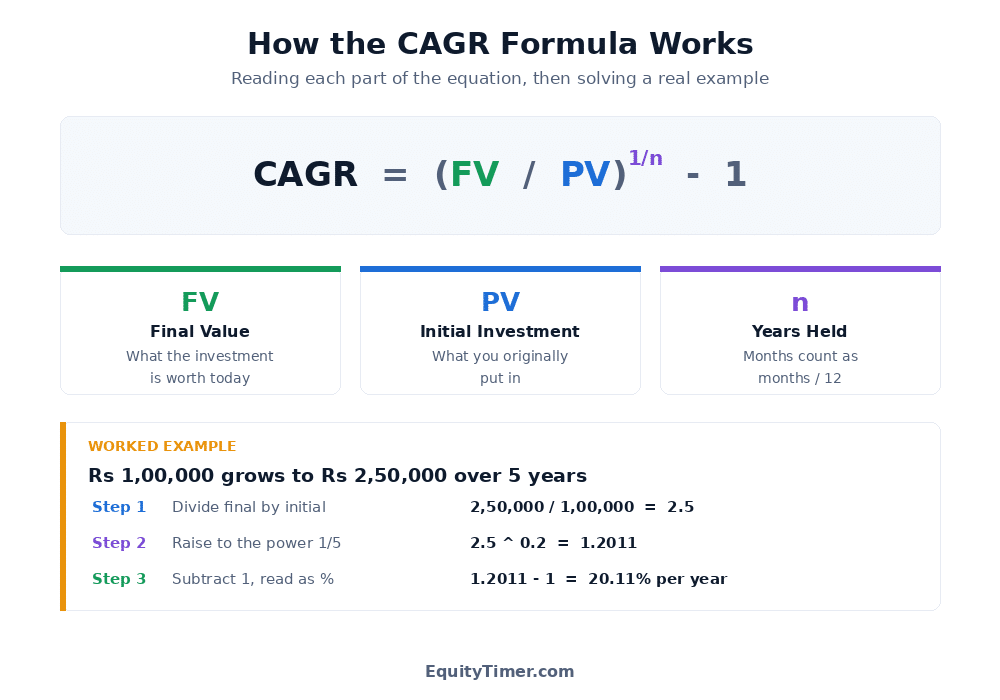
Suppose ₹1,00,000 becomes ₹2,50,000 over five years. The money grew two-and-a-half times, but it did not grow 30% every year. The CAGR works out to 20.11% per year. That single figure is the steady rate that would have carried ₹1,00,000 to exactly ₹2,50,000 in five years:
| End of year | Value at 20.11% a year |
|---|---|
| Year 1 | ₹1,20,112 |
| Year 2 | ₹1,44,270 |
| Year 3 | ₹1,73,286 |
| Year 4 | ₹2,08,138 |
| Year 5 | ₹2,50,000 |
What CAGR is not
CAGR is not a record of what actually happened each year. The real investment may have fallen 20% in year two and jumped 60% in year four. CAGR is a summary, deliberately smoothed. It is also not a forecast — a 20% CAGR over the last five years says nothing about the next five. And it is not a promise of steady yearly returns; no market delivers the same percentage twelve months in a row.
Absolute return and why it is not enough
Absolute return is the simplest measure of investment performance there is: how much did the money grow, in percentage terms, from start to finish? If ₹1,00,000 becomes ₹2,50,000, the gain is ₹1,50,000, which is 150% of what you invested. That is the absolute return.
It is easy to calculate, easy to explain, and genuinely useful for short holdings. Its weakness is equally simple: it contains no information about time. Absolute return treats a gain earned in six months and the same gain earned over fifteen years as identical achievements, which they plainly are not.
Where absolute return is the right measure
- Holdings under one year. Annualising a three-month result stretches a short run of luck into a yearly claim it cannot support.
- Reporting a single trade’s outcome. “That position gained 18%” is clear and needs no adjustment.
- Explaining total growth to someone quickly. “The money grew 150%” lands faster than “it compounded at 20.11% a year”.
The moment a comparison enters the picture — this fund against that one, your portfolio against an index — absolute return stops being adequate, because the two things being compared are almost never held for exactly the same period.
The CAGR and absolute return formulas
Both measures use the same two numbers: what you put in and what it is worth now. CAGR simply adds a third — time.
Absolute return
Absolute Return % = ( ( FV − PV ) ÷ PV ) × 100
Using ₹1,00,000 growing to ₹2,50,000: (2,50,000 − 1,00,000) ÷ 1,00,000 × 100 = 150%. Notice that no duration appears anywhere in the calculation.
CAGR
CAGR = ( FV ÷ PV )1/n − 1
Where FV is the final value, PV is the initial investment, and n is the number of years. Multiply the result by 100 to read it as a percentage.
Handling part-years
Real holdings rarely end on a clean anniversary. Months are handled by converting them into a fraction of a year: n = years + (months ÷ 12). A holding of 2 years and 6 months gives n = 2.5. The EquityTimer calculator has a separate Extra Months field precisely so you do not have to work this out yourself.
Same money, shorter time: ₹1,00,000 to ₹2,50,000 in 5 years is a CAGR of 20.11%, but reaching the same ₹2,50,000 in 2 years 6 months is a CAGR of 44.27%. The absolute return is 150% in both cases.
When the value has fallen
The formula works unchanged for losses — the result simply comes out negative. If ₹1,00,000 falls to ₹80,000 over three years, the CAGR is −7.17% per year and the absolute return is −20%. A negative CAGR is not an error; it is the honest annual rate of decline.
Investment multiple
Multiple = FV ÷ PV
Often quoted as “2.5x”, this is just the absolute return written another way — 150% growth and 2.5x are the same fact. It is a convenient shorthand, but like absolute return it says nothing about how long the money took to get there.
CAGR vs absolute return: a direct comparison
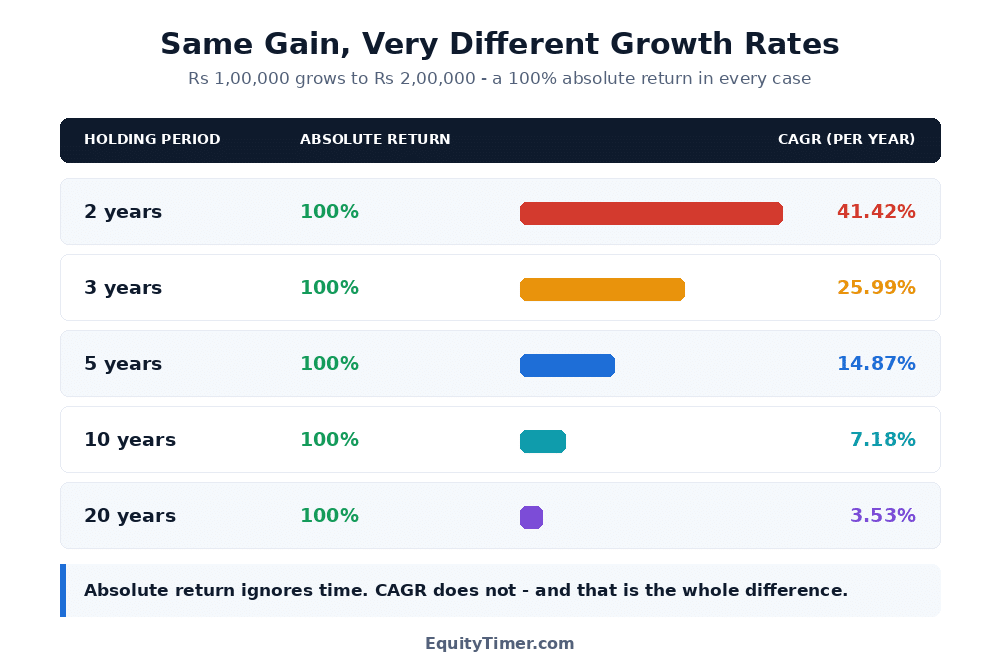
The clearest way to see the difference is to hold the gain constant and vary only the time. In every row below, ₹1,00,000 has doubled to ₹2,00,000 — an absolute return of 100% throughout. Only the holding period changes.
| Holding period | Absolute return | CAGR (per year) | What it means |
|---|---|---|---|
| 2 years | 100% | 41.42% | Exceptionally fast growth |
| 3 years | 100% | 25.99% | Strong growth |
| 5 years | 100% | 14.87% | Solid long-term growth |
| 10 years | 100% | 7.18% | Modest growth |
| 20 years | 100% | 3.53% | Barely ahead of a savings rate |
Read that table again and the point becomes hard to miss. An investor who says “I doubled my money” has told you almost nothing until they say over what period. Doubling in two years and doubling in twenty are separated by a factor of more than eleven in annual growth terms.
Which measure to use, and when
| Measure | What it tells you | Best used for | Main limitation |
|---|---|---|---|
| Absolute return | Total percentage gain or loss | Holdings under a year; reporting one trade’s outcome | Ignores time completely |
| CAGR | Smoothed growth rate per year | Comparing multi-year investments held for different periods | Hides volatility; assumes one lump sum with no additions |
| XIRR | Annualised return across many dated cash flows | SIPs, staggered buying, partial withdrawals | Needs every transaction date and amount |
A practical rule: under a year, use absolute return; over a year with a single lump sum, use CAGR; over a year with money going in or out along the way, use XIRR.
How to use the CAGR calculator
The EquityTimer CAGR & Absolute Return Calculator is free, needs no login, and updates as you type. You enter four numbers and it computes every measure at once.
The four inputs
| Field | What to enter |
|---|---|
| Initial Investment | The amount you originally put in, before any charges |
| Final Value | What the holding is worth today, or what it was worth when you sold |
| Duration (Years) | Whole years held — enter 0 if the holding is under a year |
| Extra Months | The leftover months, 0 to 11, added on top of the years |
Each field has both a slider and a typed box. Drag the slider for a quick look, or type an exact figure when precision matters — the two stay in step automatically.
Reading the results
- CAGR appears in the large green panel — the headline annual growth rate.
- Absolute Return shows total percentage growth, ignoring time.
- Total Gain is the rupee profit or loss: final value minus initial investment.
- Investment Multiple expresses the same result as “2.50x” style shorthand.
- The donut chart splits the final value into the part you invested and the part that was gained.
If the final value is lower than the initial investment, the gain figures turn red and the CAGR shows as a negative rate — the calculator handles losses as readily as gains.
The year-wise table
Below the calculator, a table projects your initial investment forward at the computed CAGR, year by year. This is the smoothed path — a useful way to see how compounding accelerates in later years, and a reminder that the actual investment almost certainly did not follow this line.
A worked walkthrough
Say you invested ₹1,00,000 and the holding is now worth ₹2,50,000 after 5 years. Enter 100000, 250000, 5 and 0. The calculator returns a CAGR of 20.11%, an absolute return of 150%, a gain of ₹1,50,000, and a multiple of 2.50x. Now change the years to 2 and the extra months to 6, and the CAGR jumps to 44.27% while the absolute return stays at 150% — the whole lesson of this article in one edit.
What CAGR hides — and what to use instead
CAGR is a genuinely useful summary, but a summary is by definition incomplete. Four things it leaves out are worth knowing before you rely on it.
1 · It makes volatility invisible
Consider two investments that both turn ₹1,00,000 into ₹2,50,000 over five years. Both have a CAGR of exactly 20.11%. Their journeys could not be more different:
| End of year | Steady investment | Volatile investment |
|---|---|---|
| Year 1 | ₹1,20,112 | ₹1,55,000 |
| Year 2 | ₹1,44,270 | ₹1,08,500 |
| Year 3 | ₹1,73,286 | ₹1,79,025 |
| Year 4 | ₹2,08,138 | ₹1,39,640 |
| Year 5 | ₹2,50,000 | ₹2,50,000 |
The second investor watched their holding fall 30% in year two and another 22% in year four. The CAGR of both is identical. If you cannot sit through drawdowns like that, the headline rate alone will not tell you whether an investment suits you.
2 · It is sensitive to start and end dates
CAGR is a point-to-point measure: it looks only at the first value and the last. Measure from a market low to a market high and the figure flatters; measure from a high to a low and it damns. Whenever you see a CAGR quoted, check what dates it runs between, and compare it against a benchmark index over exactly the same window.
3 · It assumes one lump sum, untouched
The formula has room for exactly two amounts. If you invested monthly through an SIP, added a bonus mid-way, or withdrew a portion, CAGR cannot represent what happened — each rupee was invested for a different length of time. The correct measure there is XIRR, which weights every cash flow by its own date. Applying CAGR to a SIP by comparing total invested against current value typically overstates the return, because it credits money invested last month with the full holding period.
4 · It is before tax and costs
The CAGR you calculate from purchase and current value is a gross figure. Brokerage, statutory charges, fund expense ratios and capital gains tax all reduce what actually reaches you. Your realised, post-tax CAGR will be lower than the headline number.
A quick sanity check: the Rule of 72
Dividing 72 by a growth rate gives a close approximation of how many years the money takes to double. It is a handy way to check whether a CAGR figure feels plausible:
| CAGR | Rule of 72 estimate | Actual doubling time |
|---|---|---|
| 6% | 12.0 years | 11.9 years |
| 8% | 9.0 years | 9.0 years |
| 10% | 7.2 years | 7.3 years |
| 12% | 6.0 years | 6.1 years |
| 15% | 4.8 years | 5.0 years |
| 20% | 3.6 years | 3.8 years |
The approximation is closest in the 6% to 12% range and drifts a little at higher rates, which is exactly where a rough mental check is most useful.
Common mistakes when calculating returns
Annualising a holding of under one year
A 10% gain in six months looks like a 21% annualised rate when run through the CAGR formula. That figure is arithmetically correct and practically misleading — it projects half a year of results across a full year as though the pattern would simply continue. For short holdings, report the absolute return and state the period.
Leaving out dividends
Calculating CAGR from purchase price to current price alone measures price return. Any dividends you received are missing. To measure total return, either add the dividends received to your final value, or use a total-return series that assumes they were reinvested. For high-dividend sectors this gap can be substantial over long periods.
Comparing CAGRs from different time windows
A fund’s 5-year CAGR and another fund’s 3-year CAGR are not comparable numbers, because they cover different market conditions. Always line up the same start and end dates before drawing any conclusion, and check the same window for the benchmark index too.
Using CAGR for a SIP
This is the most frequent error in practice. Dividing the current value of an SIP by the total amount invested and running it through CAGR ignores the fact that your first instalment has been invested for years and your last for weeks. Use XIRR for any investment with multiple dated cash flows.
Treating CAGR as a forecast
A historical CAGR describes what already happened under conditions that will not repeat exactly. It is a measurement, not a projection, and past performance does not indicate future results.
Ignoring costs and taxes
Comparing a gross equity CAGR against a post-tax fixed deposit rate is not a like-for-like comparison. Bring both to the same basis — either gross or net of tax and charges — before deciding which grew faster.
EquityTimer publishes factual, educational tools and data only. It is not a SEBI-registered investment adviser, and nothing here is a recommendation to buy, sell or hold any security.
Frequently asked questions
What is a good CAGR for a stock or mutual fund?
There is no universal threshold, and any specific number quoted as a target should be treated with caution. A CAGR is only meaningful in context: compare it with a relevant benchmark index over the same start and end dates, with peers in the same category, and against the inflation rate for the period. A 12% CAGR in a stretch when the broad market compounded at 15% is a different result from the same 12% in a period when the market returned 8%. Judge the figure relative to its own window, not against a remembered rule of thumb.
Is CAGR the same as annual return?
No. An annual return is what an investment actually did in one specific year. CAGR is a single smoothed rate that, if repeated every year, would produce the observed start-to-finish result. A holding with yearly returns of +40%, −15% and +25% never returned its CAGR in any individual year — the CAGR is a summary of the whole period, not a description of any one year within it.
Can CAGR be negative?
Yes. If the final value is lower than the initial investment, the CAGR comes out negative and represents the average annual rate of decline. For example, ₹1,00,000 falling to ₹80,000 over three years gives a CAGR of −7.17% per year, alongside an absolute return of −20%. The EquityTimer calculator handles negative results without any special adjustment.
Should I use CAGR or absolute return for a 6-month investment?
Use absolute return. Annualising a sub-one-year result projects a short run of performance across a full year, which overstates what has actually been demonstrated — a 10% gain over six months converts to roughly 21% annualised, a number the investment has not earned. For holdings under a year, state the plain percentage gain and the period alongside it.
Why is CAGR wrong for SIP investments?
Because CAGR assumes a single lump sum invested on day one and left untouched. In an SIP, every instalment has its own investment date, so each rupee has been compounding for a different length of time. Comparing total amount invested against current value and applying CAGR credits your most recent instalment with the full holding period, which typically overstates the return. XIRR is the correct measure, as it weights each cash flow by its actual date.
Does CAGR include dividends?
Only if you include them yourself. A CAGR calculated from purchase price to current price measures price return alone. To capture total return, add the dividends you received to the final value before calculating, or work from a total-return index or NAV series that already assumes reinvestment. In dividend-heavy sectors, the difference between price return and total return can be material over long holding periods.
Is the CAGR shown pre-tax or post-tax?
Pre-tax. The calculator works purely from the initial and final values you enter, so the result is a gross figure. Brokerage, statutory charges, fund expense ratios and capital gains tax all reduce the return that actually reaches you. If you want a post-tax figure, enter the net amount you received after charges and tax as the final value.
How is CAGR different from average return?
A simple average adds the yearly returns and divides by the number of years, which ignores compounding and overstates the result whenever returns vary. Take returns of +50% and −50% over two years: the simple average is 0%, yet ₹1,00,000 becomes ₹1,50,000 and then ₹75,000 — a real loss. CAGR reflects the actual start-to-finish outcome, which is why it is the more reliable measure for multi-year periods.
Educational and informational content only. EquityTimer is not a SEBI-registered investment adviser and does not provide buy, sell or hold recommendations. Calculations are illustrative and exclude taxes, brokerage and other charges unless you account for them in the values you enter. Verify all figures independently and consult a registered financial adviser before making any investment decision.