Secrets of Delta in Options Trading: The Complete Beginner’s Guide
If you don’t have time to read, just listen to the audio guide about Delta in Options Trading,
About this article: This guide explains Delta — the most important of the option Greeks — in simple English for Indian traders. You will learn what Delta measures and how to read it across in-the-money, at-the-money and out-of-the-money strikes; why calls carry positive Delta and puts negative; how traders use Delta as a quick probability gauge and as a measure of share-equivalent exposure; and why Delta is never fixed — how Gamma, implied volatility and time keep changing it. Every concept is illustrated with Nifty examples and original charts, and a short FAQ at the end answers the most common Delta questions. This is Part 1 of a two-part series; Part 2 covers delta hedging and delta-neutral trading.
What is Delta?
The core idea in one line
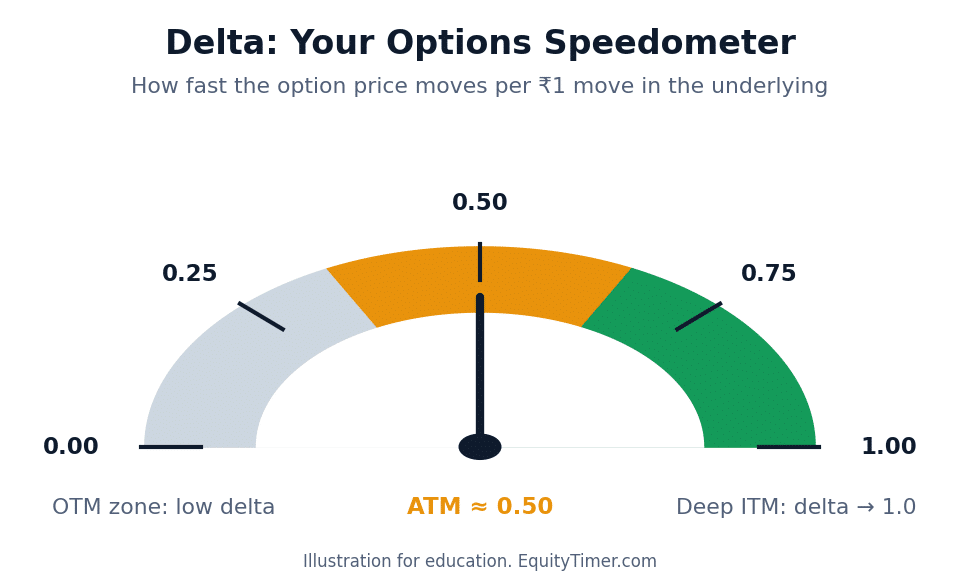
Delta measures how much an option’s price should change when the underlying asset moves by one unit — one rupee for a stock, or one point for an index like the Nifty.
Take a simple example. Suppose a Nifty call option has a Delta of 0.50. If the Nifty rises by 1 point, the option’s premium should rise by about 0.50 points. If the Nifty rises 50 points, the premium should gain roughly 25 points (50 × 0.50). Nothing else needs to change — Delta isolates the effect of price alone.
A helpful way to picture it: Delta is your option’s speedometer. A speedometer tells you how fast your car is moving without you having to stick your head out of the window. Delta tells you how fast your option’s value will move for every 1-point move in the underlying — without you having to guess.
Calls vs puts: the sign matters
Positive for calls, negative for puts
Call options have a positive Delta between 0 and +1, because a call gains value when the underlying rises. Put options have a negative Delta between 0 and −1, because a put gains value when the underlying falls.
So a put with a Delta of −0.40 should gain about 0.40 points when the Nifty falls 1 point, and lose about 0.40 when it rises 1 point.
One more twist: selling flips the sign. If you short a call, your position Delta is negative; if you short a put, it is positive. This becomes important when you add up the Delta of a whole portfolio — something we cover in Part 2 of this guide.
For reference, a futures contract has a Delta of exactly 1.00 — it moves one-for-one with the underlying.
How to read Delta: ITM, ATM, OTM
The three buckets every trader uses
Traders usually think about Delta in three buckets, based on “moneyness” — where the strike sits relative to the market price:
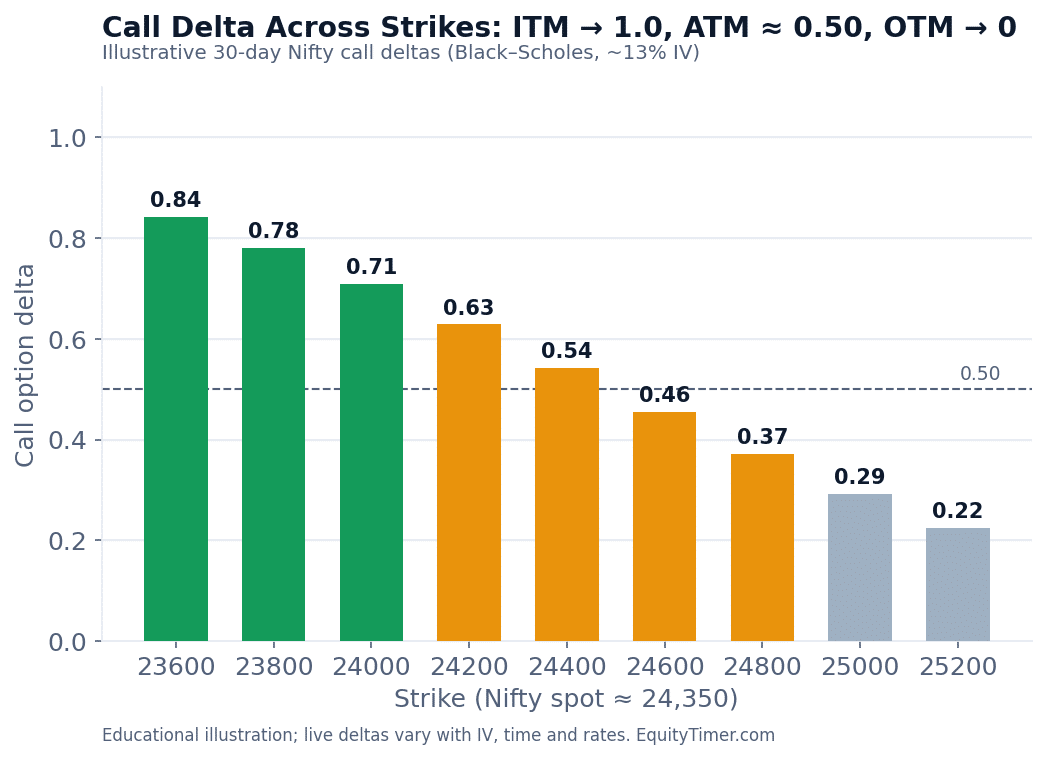
- Deep in-the-money (ITM): Delta approaches 1.00. These options move almost one-for-one with the underlying — they behave nearly like the index or stock itself.
- At-the-money (ATM): Delta is close to 0.50. The option moves about half as much as the underlying.
- Out-of-the-money (OTM): Delta approaches 0. These options barely react to small moves in the underlying.
Here is what that looks like across real Nifty strikes with the index near 24,350:
Delta is written as a decimal (0.50), but traders often drop the point and just say “a 50-delta option.” Both mean the same thing.
Delta as probability
The trader’s shortcut
Here is the interpretation many traders find most useful: Delta is a rough estimate of the probability that the option will expire in the money.
A call with a Delta of 0.76 can be read as having roughly a 76% chance of finishing in the money at expiry. A 0.30-delta option, about a 30% chance. An at-the-money option, close to a coin flip — which is exactly why its Delta sits near 0.50.
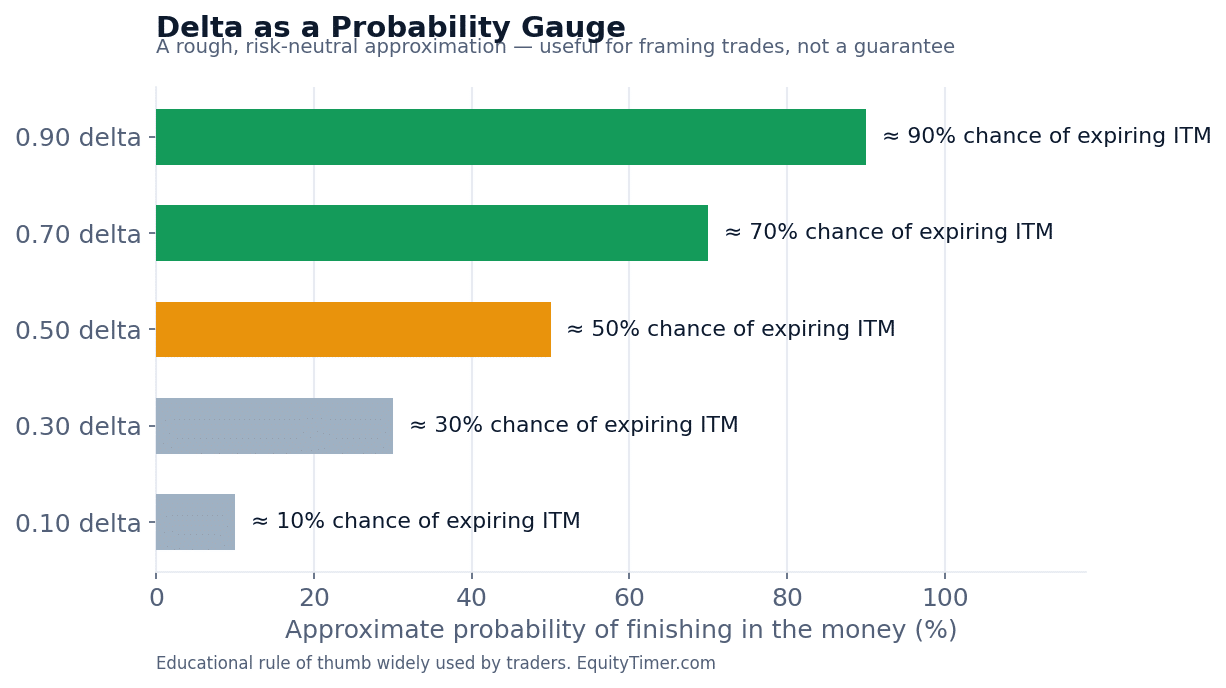
Two honest caveats. First, this is a risk-neutral approximation derived from the pricing model, not a real-world guarantee. Second, different models and different volatility inputs produce slightly different Deltas — so treat it as a framing tool for decisions, not a precise forecast.
Used that way, it is powerful: instead of thinking in formulas, a beginner can look at a 0.20-delta option and immediately understand “the market is pricing about a one-in-five chance this finishes in the money.”
Delta as share equivalence
What your option “trades like”
There is a third reading of Delta: it tells you how much underlying exposure your option behaves like. A call with a Delta of +0.35 moves like a holding of 35% of the underlying quantity.
In Indian index options, quantity comes in lots. The Nifty 50 lot size is 65 units (as of 2026 contracts — always check the latest NSE circular). So one Nifty call with a Delta of 0.50 behaves like being long about 32–33 units of the index (0.50 × 65).
This “equivalence” view is exactly what professionals use to hedge positions — the subject of Part 2.
Why Delta is not static
The insight beginners miss
The single most common misunderstanding about Delta: traders assume that if they bought a 0.76-delta option, it stays a 0.76-delta option. It does not. Delta changes constantly. Three forces move it:
- Gamma. Gamma is the Greek that measures how much Delta itself changes for a 1-point move in the underlying. Delta is speed; Gamma is acceleration. When the market moves, Gamma is what drags your Delta up or down.
- Implied volatility (IV). When the market’s expected volatility changes, Deltas shift — in a very specific pattern shown in the next tab.
- Time. As expiry approaches, ITM deltas drift toward 1, OTM deltas decay toward 0, and options near the strike become increasingly twitchy.
The practical lesson: track your Delta exposure through the life of a trade, rather than assuming the number you saw at entry still applies.
Volatility pulls Delta toward 0.50
What high-VIX markets do to your options
Here is the pattern, and it is worth memorising: as implied volatility rises, all Deltas converge toward 0.50. In-the-money Deltas come down toward 0.50; out-of-the-money Deltas rise toward 0.50. When volatility falls, the opposite happens — Deltas spread back out toward their extremes.
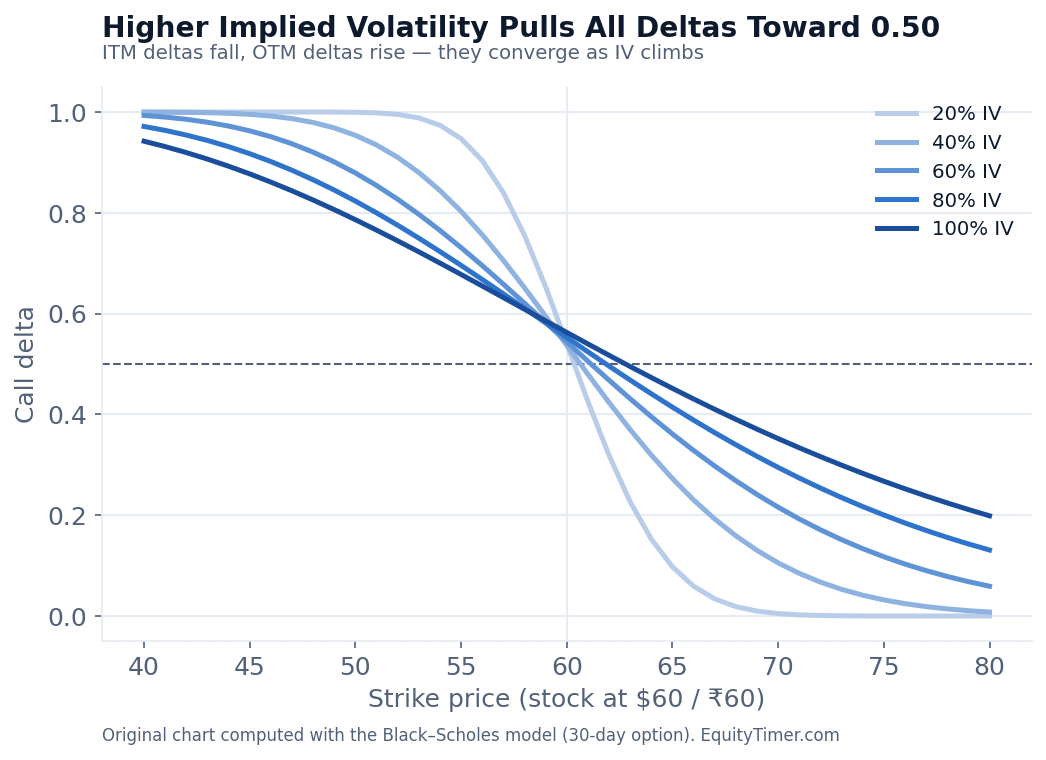
The intuition: imagine volatility so extreme that nobody can say where the market will settle tomorrow. In that world, every option — whatever its strike — starts to look like a coin flip. And a coin flip is a 0.50 delta.
This is not just theory. In crisis periods — think of the 2008 financial crisis, when daily triple-digit index swings became routine — implied volatility spiked so high that Deltas across the board compressed toward 0.50, and options behaved very differently from what calm-market intuition suggested. In India, a rising India VIX (the NSE’s volatility index, launched in 2008) signals the same force acting on Nifty option Deltas.
The three things to remember
Delta in 30 seconds
- Sensitivity. Delta tells you how much your option should move per 1-point move in the underlying. A 0.30-delta option on a 100-point Nifty rally should gain about 30 points.
- Probability. Delta approximates the chance of expiring in the money — a fast, intuitive way to frame any trade.
- Dynamic. Delta is not fixed. Gamma, implied volatility and time all move it, so your exposure today is not your exposure tomorrow.
Once these three click, you are ready for the practical side: adding Deltas across positions, and hedging with them. That is Part 2: Delta Hedging & Delta-Neutral Trading on Nifty.
Frequently asked questions
Quick answers about Delta
What is Delta in options trading, in simple terms?
Delta is the amount an option’s price should change when the underlying stock or index moves by one unit. A 0.50-delta Nifty call should gain about 0.50 points for every 1-point rise in the Nifty. Think of it as your option’s speedometer.
What does a 0.50 delta mean?
Three things at once: the option moves about half as much as the underlying; it has roughly a 50% chance of expiring in the money; and it behaves like holding about half the underlying quantity. Options at the money typically carry a delta near 0.50.
Is Delta the probability of profit?
Not exactly. Delta approximates the probability of the option expiring in the money — not the probability of your trade being profitable, which also depends on the premium you paid. It is a useful rough gauge, not a guarantee, and different pricing models can show slightly different deltas.
Why is put option delta negative?
Because puts gain value when the underlying falls. The negative sign simply captures that inverse relationship: a −0.40-delta put gains about 0.40 points when the index drops 1 point. Selling a put flips the sign back to positive.
What makes Delta change?
Three forces: Gamma (price moves change Delta itself), implied volatility (rising IV pulls all deltas toward 0.50), and time (as expiry nears, ITM deltas drift toward 1 and OTM deltas toward 0). Delta is dynamic, so exposure should be tracked, not assumed.
Where can I see the Delta of a Nifty option?
Most Indian broker platforms and the NSE option chain display Greeks, including Delta, alongside each strike. Free option-Greeks calculators also compute it from the spot price, strike, expiry, interest rate and implied volatility.